Many traders start Forex with a screen full of indicators. Moving averages, RSI, MACD and oscillators can be useful, but they can also make a chart harder to read. A price action strategy without indicators Forex traders use takes a different approach: instead of relying on mathematical tools, it focuses on what price itself is doing.
The idea is simple. Price reflects the balance between buyers and sellers, and its movements can reveal where the market is finding support, facing resistance or changing direction. By learning to read these signals, traders can make decisions without covering the chart with extra indicators.
What Is Price Action Trading?
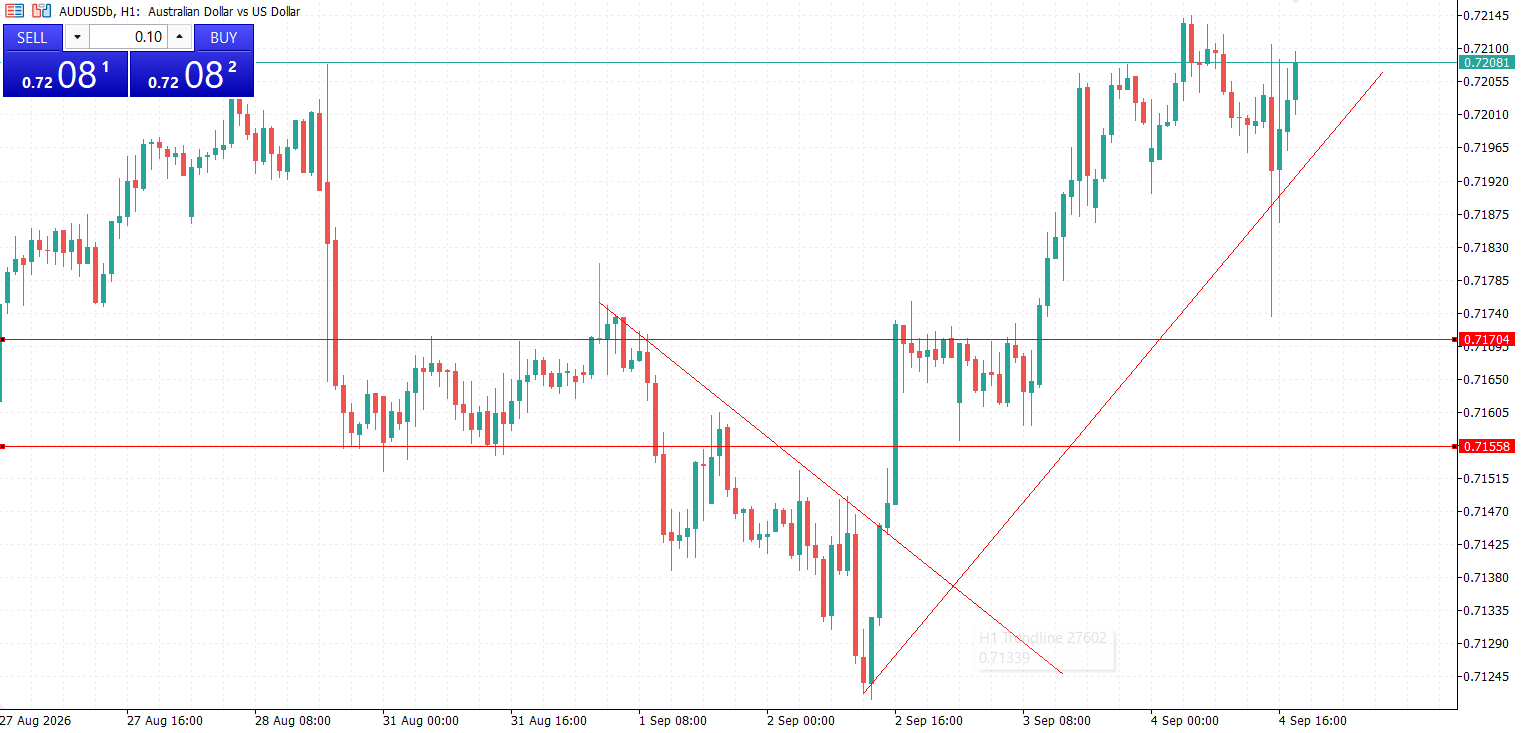
Price action trading means analyzing the market through its price movements. Traders look at candlesticks, swing highs and lows, support and resistance levels, breakouts, and market structure.
Rather than asking whether an indicator is overbought or oversold, a price action trader may ask: Is the market making higher highs and higher lows? Did price break a key level? Was the breakout accepted or rejected?
This approach can make charts cleaner and help traders focus on the most important information: price itself.
How to Read Market Structure
Market structure is one of the foundations of price action trading. In a rising market, price generally forms higher highs and higher lows. In a downtrend, the opposite is true: lower highs and lower lows.
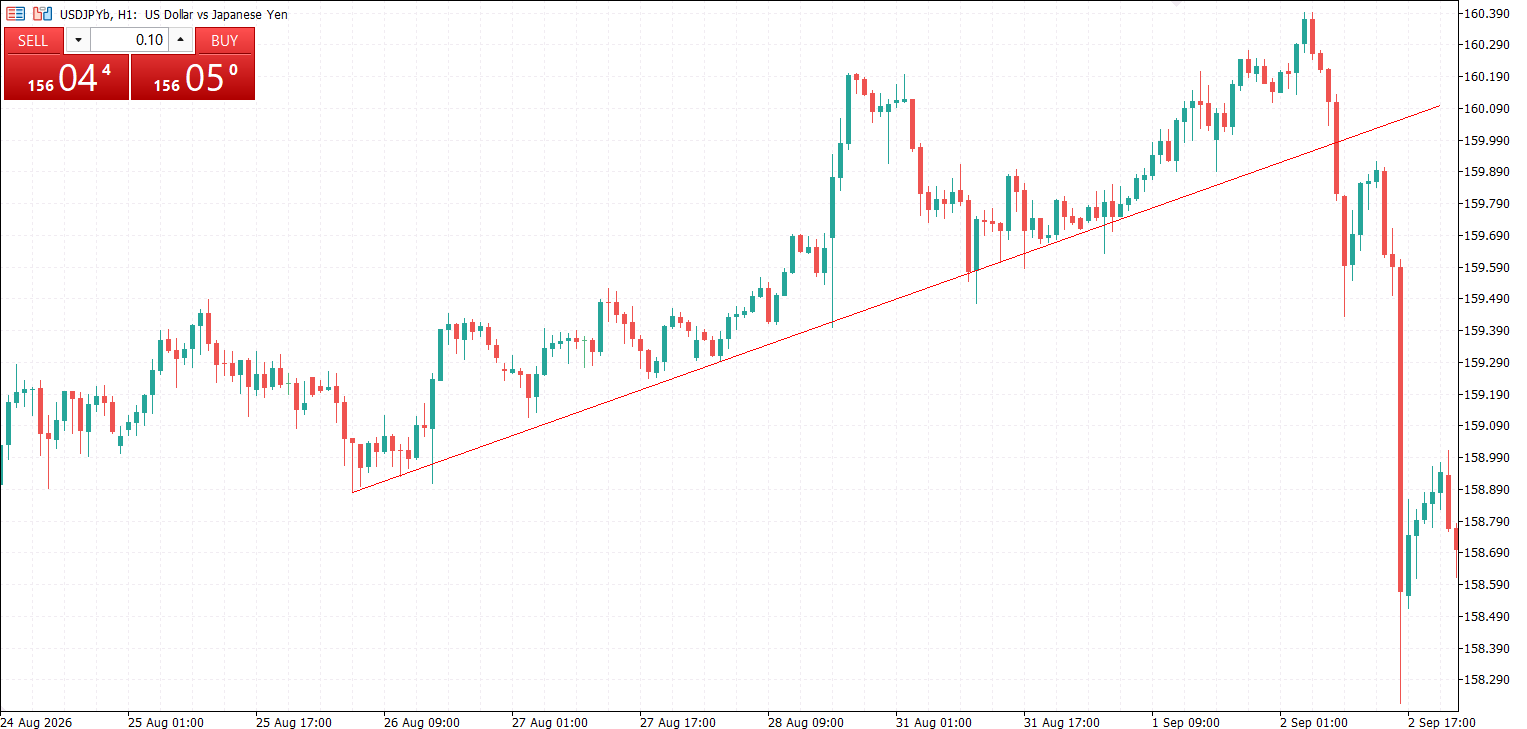
When this structure changes, it can signal that the trend is losing momentum or potentially reversing. For example, if a pair has been making lower lows but suddenly breaks above the latest lower high, traders may start watching for a shift toward a bullish structure.
The goal is not to predict every move. It is to recognize when the market is behaving differently from before.
Support and Resistance Without Indicators
Support and resistance are another key part of a Forex price action strategy. These levels can form around previous highs and lows, areas where price repeatedly reversed, or zones where strong buying or selling appeared.
A level becomes more interesting when price reacts to it clearly. A long wick followed by a strong move away from resistance, for example, may show that sellers are defending the area.
Still, support and resistance are zones rather than perfectly precise lines. Price can move slightly beyond a level before reversing, so traders should avoid treating every breakout as a signal by itself.
Candlestick Patterns That Matter
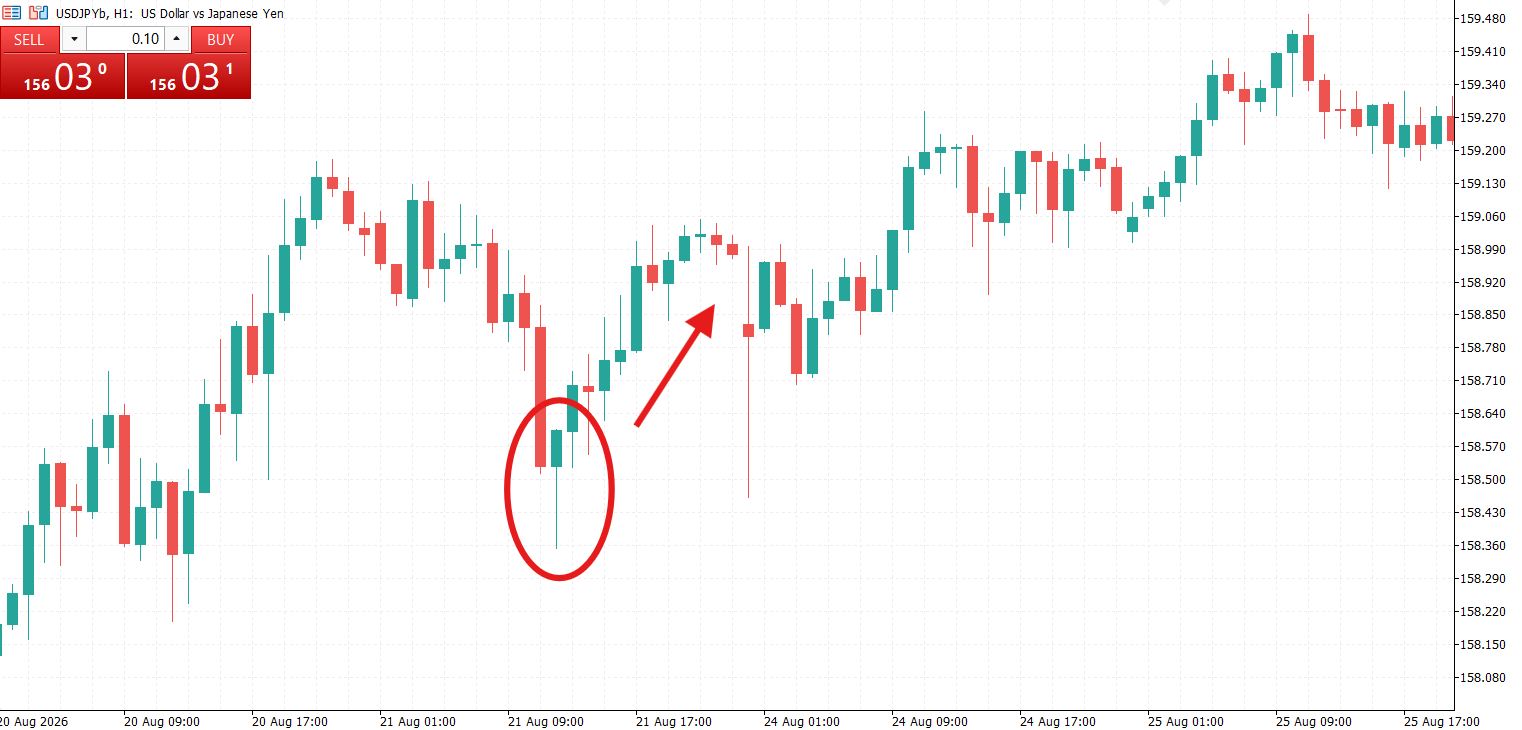
Candlestick patterns can provide useful clues about market behavior. Some of the most common include pin bars, engulfing candles and inside bars. A bullish pin bar near support may show that sellers pushed price lower but buyers quickly stepped in. A bearish engulfing candle near resistance can suggest that selling pressure has increased.
The location of the pattern matters more than the pattern itself. A pin bar in the middle of a random range is usually less meaningful than one forming at a major support or resistance zone.
A Simple Forex Price Action Setup
A basic setup can be built around a key level and a confirmation signal. First, identify a clear support or resistance zone on the higher timeframe. Then wait for the price to reach that area.
Instead of entering immediately, watch how the market reacts. A rejection candle, failed breakout or strong reversal can provide confirmation. The trade can then be planned around a logical stop-loss level beyond the recent swing.
For example, if EUR/USD approaches major resistance and briefly breaks above it before closing back below the zone, that failed breakout may create a short setup. The stop could sit above the rejection area, while the target is based on the next meaningful support zone.
This keeps the process relatively simple: level, reaction, entry, risk and target.

Price Action on Different Timeframes
Price action can be used on almost any timeframe, but the context changes. Higher timeframes generally provide a broader view of market structure, while lower timeframes offer more entry opportunities.
A trader might use the daily or four-hour chart to identify the main trend and important levels, then move to the one-hour or 15-minute chart to look for an entry.
Using multiple timeframes can help reduce the risk of taking a short-term setup against a much stronger broader trend.

Final Thoughts
A price action strategy without indicators is not about stripping the chart down to nothing and trying to predict the future. It is about keeping the analysis simple and focusing on market structure, key levels, and how price behaves around them.
The best approach is usually the one you can apply consistently. Start with a few clear concepts, test them on historical charts, and use a demo account before risking real money. With enough practice, a simple chart can provide plenty of information without a dozen indicators competing for your attention.