Crypto markets move fast, and day traders need tools that can help them understand momentum, identify trends, and find better entry points. No single indicator can predict every move, especially in a market known for sharp price swings and sudden reversals. The best approach is usually to combine a few complementary indicators that look at different parts of the market.
A strong indicator combination can help answer three key questions: Is the market trending? Is momentum supporting the move? And is there a good area to enter or exit? By combining trend, momentum, and volume-based tools, traders can filter out noise and make more informed decisions instead of relying on one signal.
Moving Averages + RSI: Finding the Trend and Timing Entries
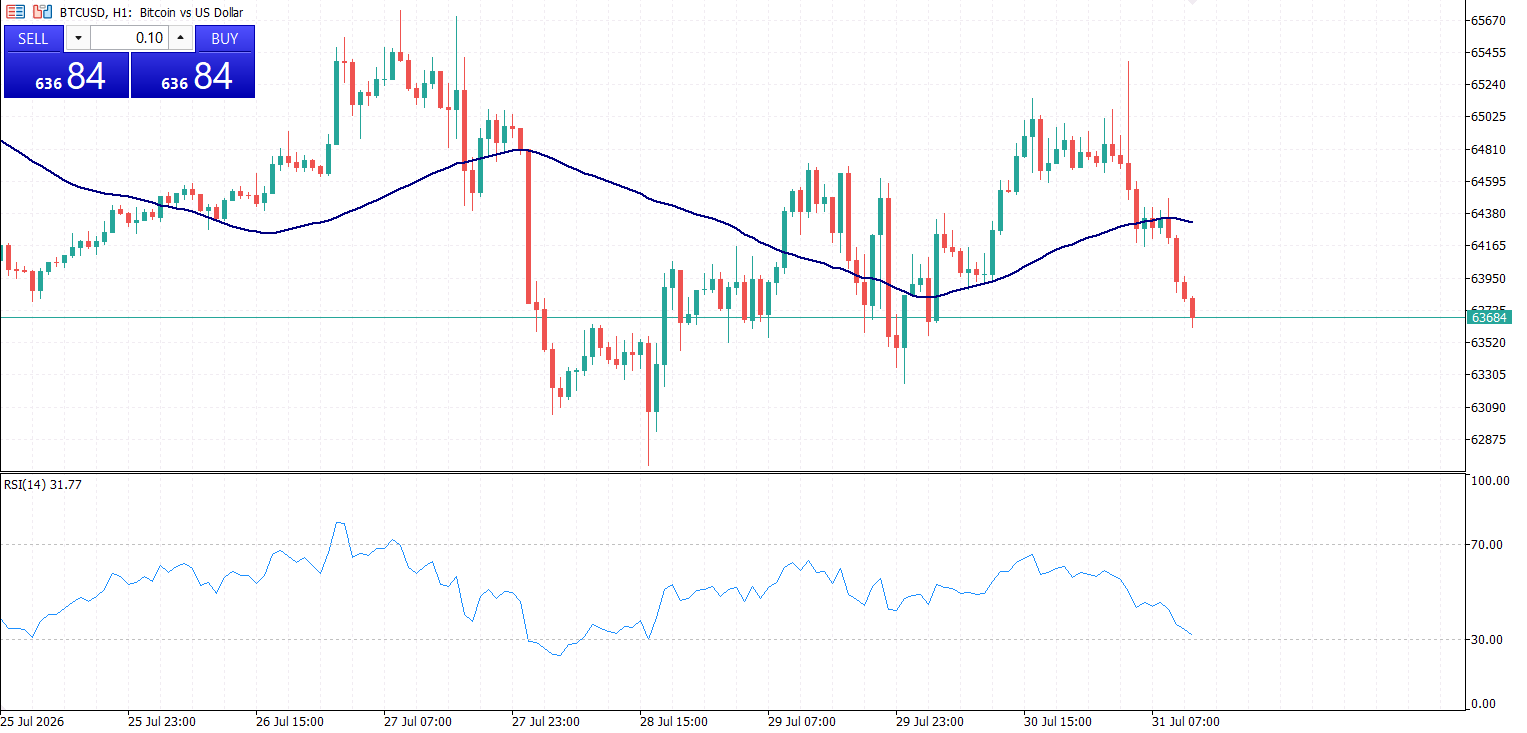
Moving averages and RSI are one of the most popular combinations among crypto day traders because they cover two important parts of market analysis: direction and momentum.
Moving averages, such as the 50 EMA and 200 EMA, help traders understand the overall trend. When price trades above the moving average, it often suggests buyers are in control, while trading below it may indicate weaker market conditions.
RSI adds another layer by showing whether momentum is becoming too strong in either direction. A rising RSI during an uptrend can confirm buying strength, while an extremely high RSI may warn that a short-term pullback is possible.
Together, these indicators can help traders avoid chasing moves that are already exhausted. For example, a bullish setup becomes stronger when price is above a key moving average and RSI confirms that momentum is still healthy.
MACD + Volume: Confirming Momentum
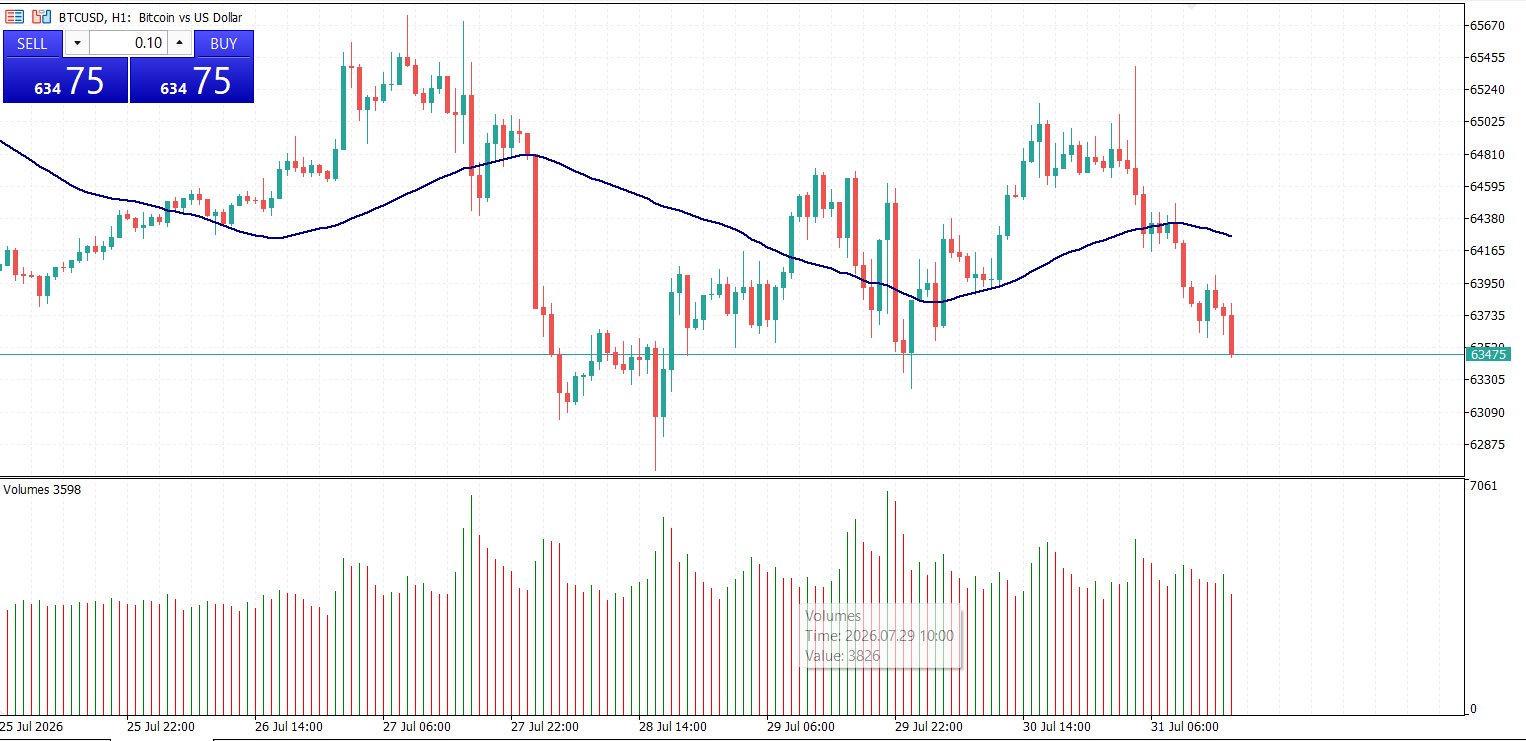
MACD is widely used by crypto traders to identify changes in momentum and possible trend shifts. However, during fast-moving markets, MACD signals can sometimes produce false moves. Adding volume analysis can help separate real breakouts from weak ones.
When MACD shows a bullish crossover and trading volume increases at the same time, it suggests that more participants are supporting the move. This combination can provide stronger confirmation that momentum is building.
On the other hand, if MACD signals a breakout but volume remains low, traders should be cautious. The move may lack enough support and could quickly reverse. Volume acts as a reality check, showing whether traders are truly backing the price movement.
Bollinger Bands + RSI: Spotting Overextended Moves
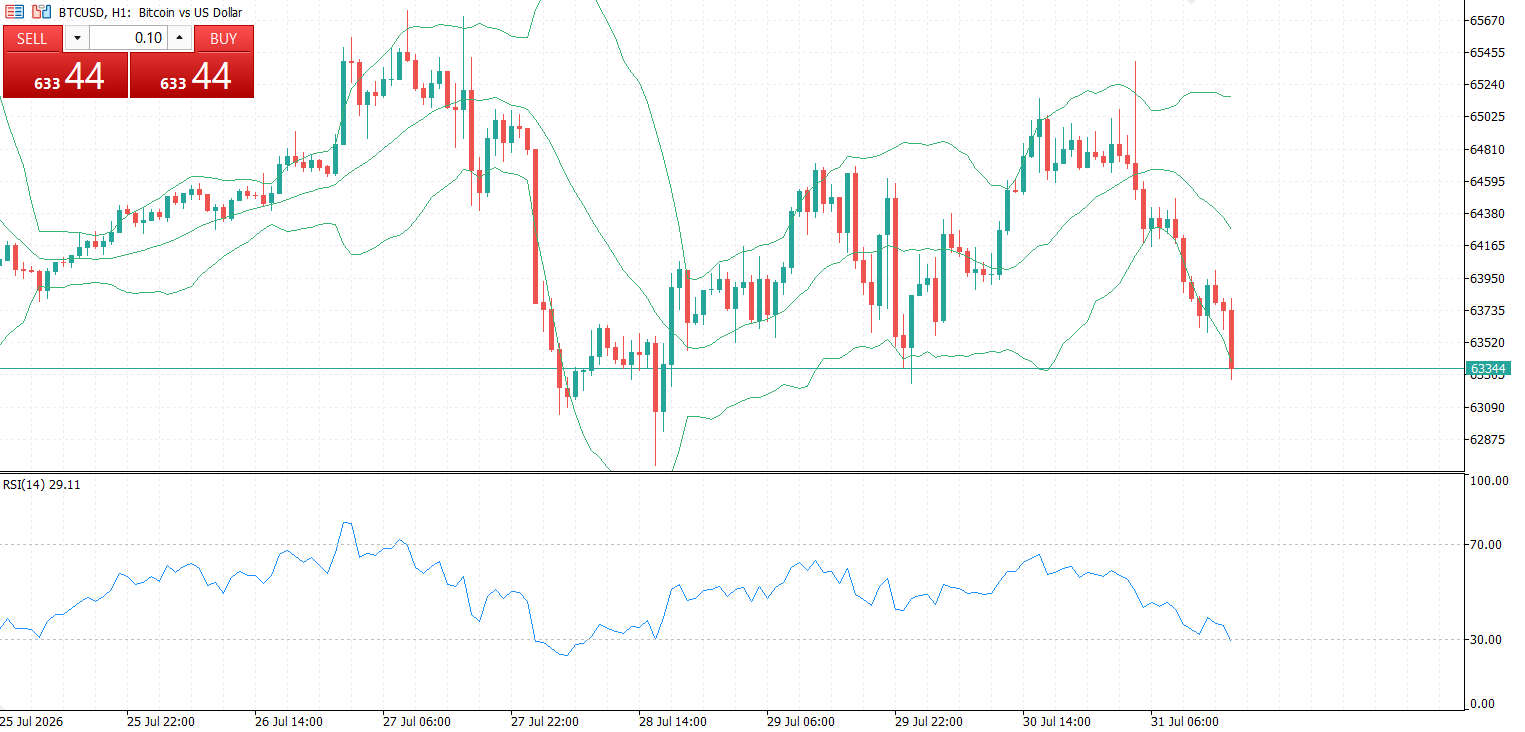
Bollinger Bands and RSI work well together for traders who focus on short-term reversals and range-bound markets. Bollinger Bands help identify periods when price moves unusually far from its average, while RSI measures the strength of that move.
When price touches the lower Bollinger Band and RSI enters oversold territory, traders may look for signs of a potential rebound. Similarly, price reaching the upper band with an overbought RSI can indicate that the market may be due for a correction.
This combination is especially useful in crypto because many assets frequently move sharply before returning toward average levels. However, traders should avoid using these signals alone during strong trends, as price can remain overbought or oversold for longer than expected.
Support and Resistance + Volume: Trading Key Levels
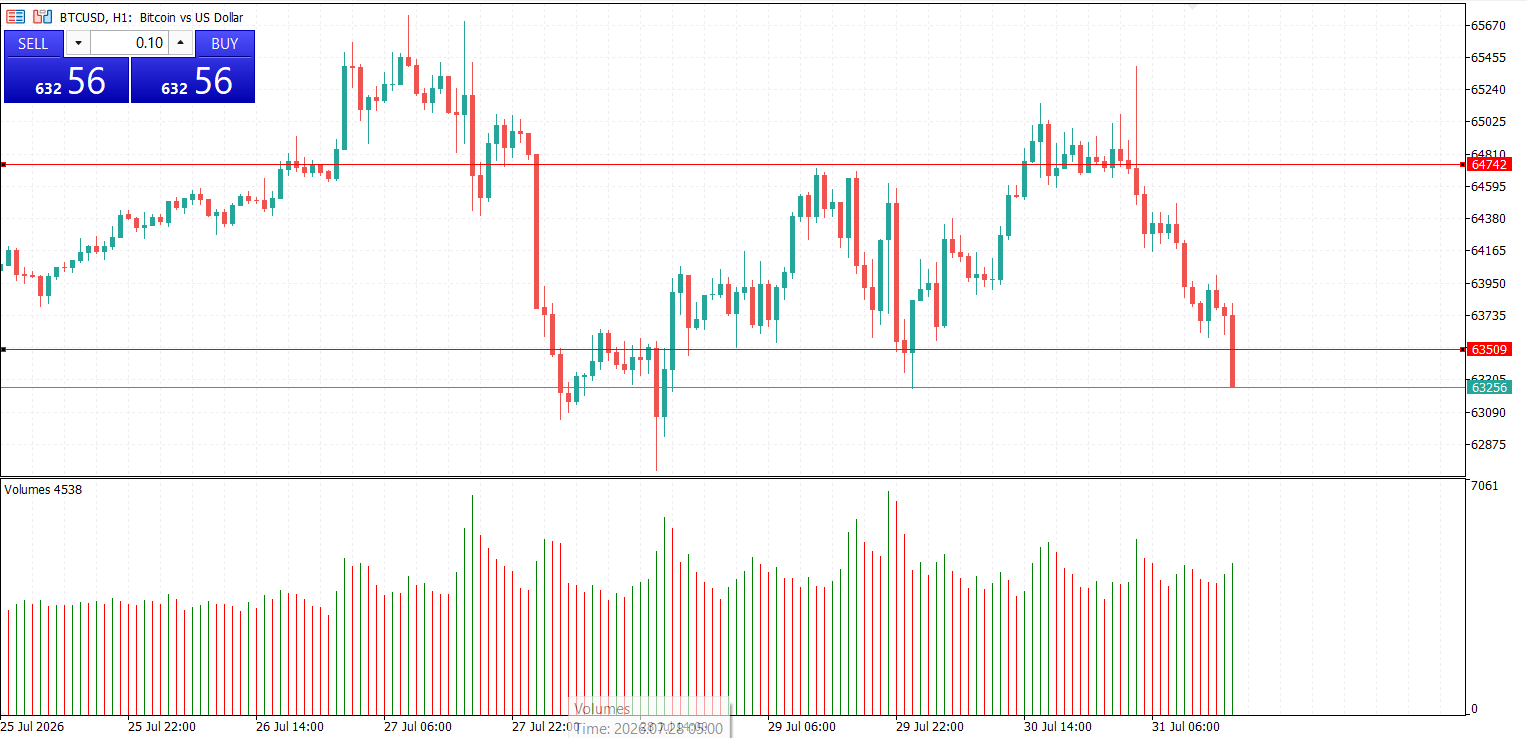
Support and resistance levels remain some of the most important tools for crypto day traders. They help identify areas where buyers or sellers are likely to become more active.
Adding volume analysis makes these levels more reliable. A breakout above resistance with strong volume suggests stronger buyer interest, while a breakout with weak volume may turn out to be a false signal.
Many traders combine these tools with other indicators to create a complete setup. For example, a trader may wait for price to break resistance, confirm the move with higher volume, and then use momentum indicators to find the best entry point.
Conclusion
The best indicator combinations for crypto day trading are not about using as many tools as possible. Too many indicators can create confusion and conflicting signals. The goal is to combine tools that complement each other and provide a clearer view of market conditions.
Moving averages help identify the trend, RSI and MACD measure momentum, Bollinger Bands highlight potential reversals, and volume confirms whether a move has real strength. When combined with proper risk management and a clear trading plan, these indicators can help traders navigate the fast-moving crypto market with more confidence.