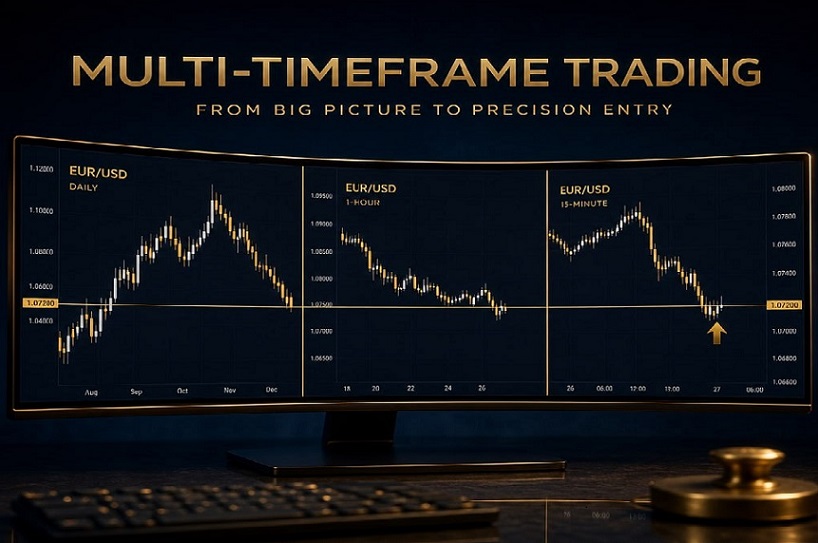
Successful trading is rarely about finding the perfect entry point on a single chart. Markets move across multiple timeframes, and a setup that looks attractive on a 15-minute chart can make little sense when viewed against the broader market trend.
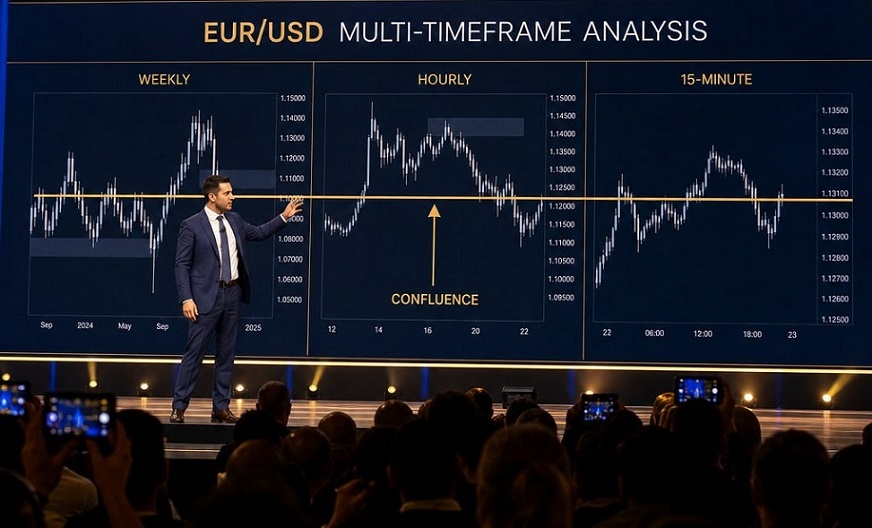
This is where multi-timeframe trading comes in. The idea is straightforward: use a higher timeframe to understand the broader market structure, a medium timeframe to identify the setup, and a lower timeframe to fine-tune the entry. Used correctly, this approach can help traders filter out weaker signals and enter positions with a clearer understanding of the market context.

Step 1: Start With the Bigger Picture
The first step is to determine the dominant market trend. For a short-term trader, the daily or four-hour chart can provide a broader context. Look at the price structure rather than focusing on individual candles. Is the market making higher highs and higher lows? That suggests an uptrend. Lower highs and lower lows point to a downtrend. If neither structure is clear, the market may be range-bound.
The goal at this stage is not to find an entry. It is to understand what the market is doing on a larger scale. For example, if the daily chart shows a clear uptrend, short setups on a 15-minute chart should be treated with greater caution. A pullback on the lower timeframe may simply be a temporary correction within the broader bullish trend.

Step 2: Identify Key Levels
Once the broader trend is established, mark the most important price levels. These can include previous highs and lows, support and resistance zones, trendlines, major breakout levels, or areas where price has repeatedly reacted in the past.
Higher-timeframe levels are generally more significant because they reflect a larger amount of market activity. A support zone visible on a daily chart can therefore become an important reference point even when trading on a much lower timeframe.
Do not fill the chart with dozens of levels. The objective is to identify the areas where the market is most likely to react.

Step 3: Move to the Setup Timeframe
The next step is to move down one timeframe. If the daily chart defines the broader trend, the four-hour or one-hour chart can be used to find a potential trading setup. This is where the trader waits for price to approach one of the key levels identified earlier.
The most important principle is patience. Price reaching a support or resistance zone does not automatically mean that a trade should be opened.
Instead, look for evidence that the market is actually reacting to the level. A bullish setup could involve a rejection of support followed by a higher low. A bearish setup might develop when price reaches resistance, fails to break it, and begins forming lower highs.
The medium timeframe should answer one key question: Is there a tradable setup within the broader market structure?

Step 4: Use the Lower Timeframe for Entry
Only after the higher- and medium-timeframe analysis is complete should you move to the lower timeframe. For intraday trading, this could be the 15-minute or five-minute chart. The purpose of the lower timeframe is not to change the market view. It is to improve execution.
For example, suppose the daily chart shows an uptrend and the four-hour chart shows a pullback toward support. The trader can wait on the 15-minute chart for a bullish reversal pattern, a break of a short-term resistance level, or a shift in market structure.
This creates a three-layer process:
- Higher timeframe → direction
- Medium timeframe → setup
- Lower timeframe → entry
That simple framework helps prevent one of the most common trading mistakes: entering a position simply because a short-term chart produces a signal.

Step 5: Define the Stop-Loss Before Entering
A trade should never be opened before the invalidation point is clear. The stop-loss should be placed where the original trading idea is no longer valid, rather than at an arbitrary distance from the entry price.
For a long position, this could be below a meaningful swing low or support zone. For a short position, it could be above a recent swing high or resistance area.
The distance to the stop also determines position size. If the stop needs to be wider, the position should generally be smaller if the trader wants to keep the amount at risk constant. This is where technical analysis and risk management come together.

Step 6: Set the Target and Check the Risk-to-Reward Ratio
Before entering, determine where the trade could reasonably reach if the setup works. The target can be based on the next major support or resistance zone, a previous swing high or low, or another clearly defined technical objective.
Then compare the potential reward with the amount being risked. A setup with a small potential upside and a wide stop may not offer an attractive risk-to-reward profile, even if the market direction appears correct.
The important point is consistency. Traders should define their risk parameters before the position is opened rather than adjusting them emotionally after the market starts moving.
Step 7: Manage the Trade Without Losing the Bigger Picture
Once the trade is open, avoid constantly switching between timeframes in search of new signals. The same multi-timeframe framework used for the entry can also guide the exit. If the higher-timeframe trend remains intact, a short-term pullback does not necessarily invalidate the position.
At the same time, a clear break of the structure that supported the original trade idea can be a reason to exit. The key is to distinguish between normal market noise and a genuine change in structure.

The Bottom Line
Multi-timeframe trading is not about using as many charts as possible. It is about giving each timeframe a specific job. The higher timeframe provides context. The medium timeframe identifies the opportunity. The lower timeframe improves execution. This approach can help traders avoid chasing isolated signals and instead build trades around a broader market structure.