
Spotting a trend reversal early can help traders find better entry points, manage risk, and avoid getting caught on the wrong side of a move. However, no indicator can predict every market turn. The key is to recognize warning signs, look for confirmation, and avoid entering a trade too soon.
In technical analysis, a trend reversal occurs when the market shifts from an uptrend to a downtrend or from a downtrend to an uptrend. Here are five ways to identify a potential reversal before it becomes obvious.

Watch for Changes in Price Structure
Price action is one of the earliest clues that a trend may be losing strength. In an uptrend, prices typically form higher highs and higher lows. If the market fails to make a new high and then breaks below the previous swing low, buyers may be losing control.
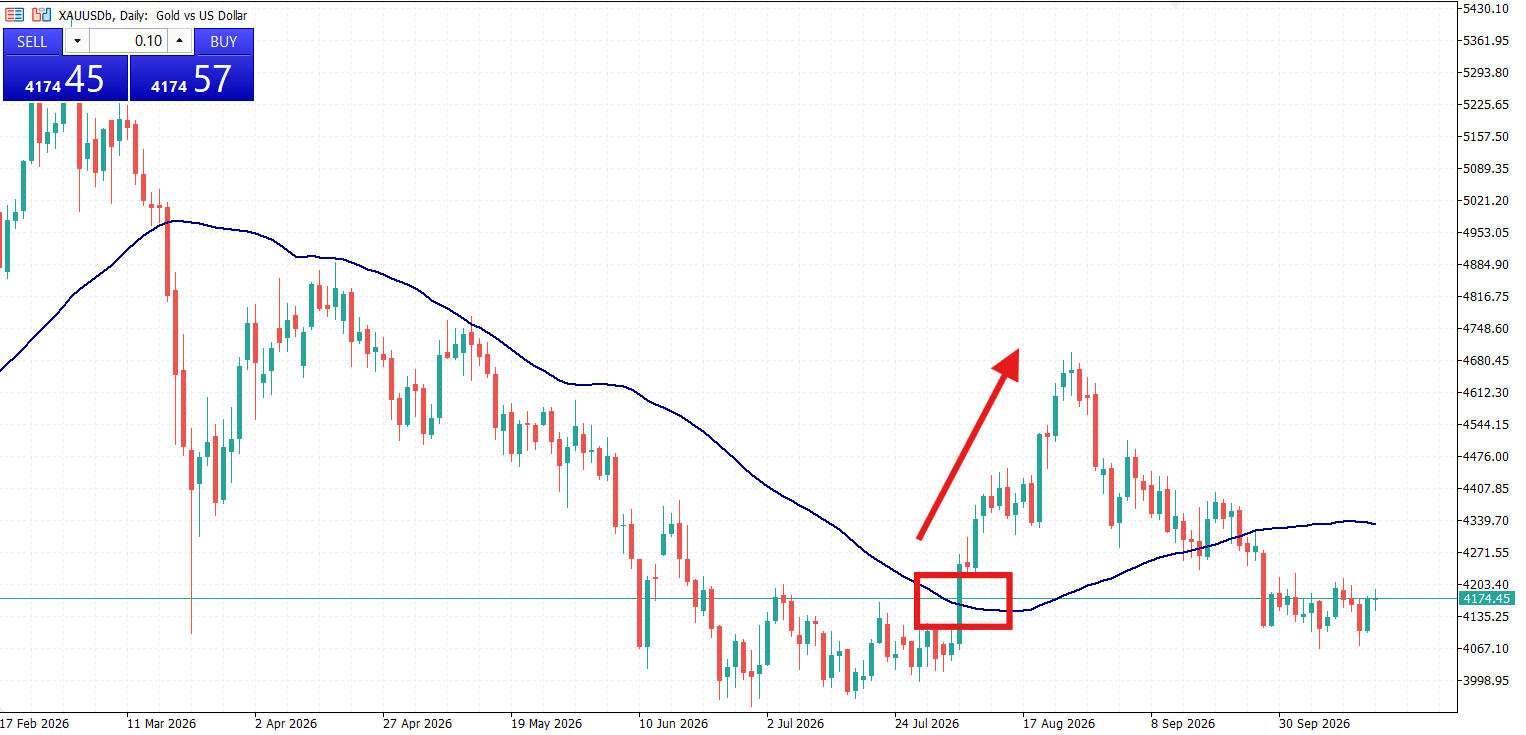
In a downtrend, prices tend to form lower highs and lower lows. A break above the latest swing high may signal that selling pressure is weakening. These changes do not guarantee a reversal, but they can provide an early warning that the current trend is losing momentum.
Look for RSI Divergence
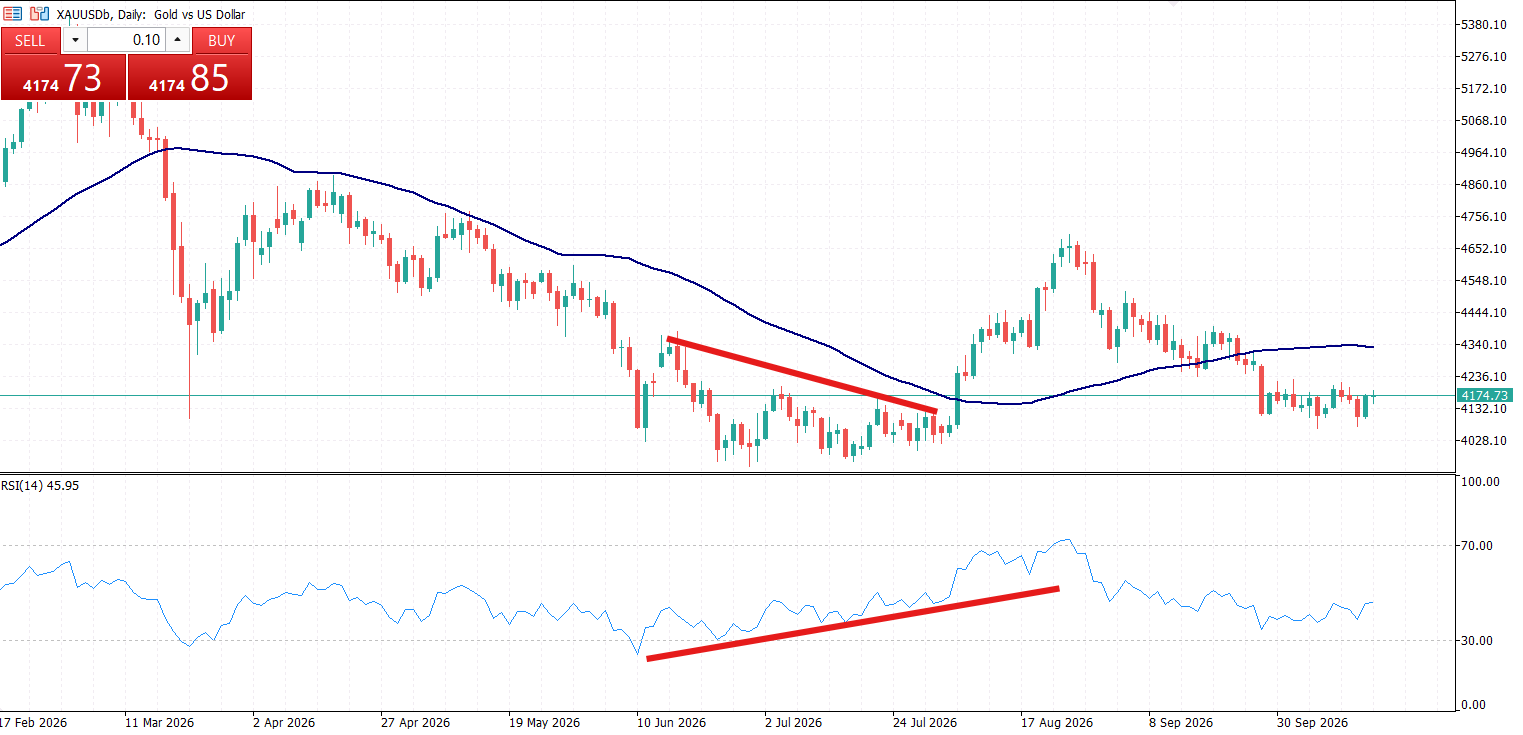
The Relative Strength Index (RSI) helps traders assess momentum and identify potential turning points. Bullish divergence occurs when the price makes a lower low, but the RSI forms a higher low. This can indicate that selling pressure is fading and an upside reversal may be approaching.
Bearish divergence occurs when the price makes a higher high, but the RSI forms a lower high. This suggests that buying momentum may be weakening.
Divergence works best when combined with price action and key support or resistance levels. On its own, it can persist for a long time without a reversal.

Identify Breakouts Around Key Levels
Support and resistance levels can help traders spot areas where a trend may change direction. During a downtrend, a break above resistance can signal that buyers are gaining strength. During an uptrend, a break below support may indicate that sellers are taking control.
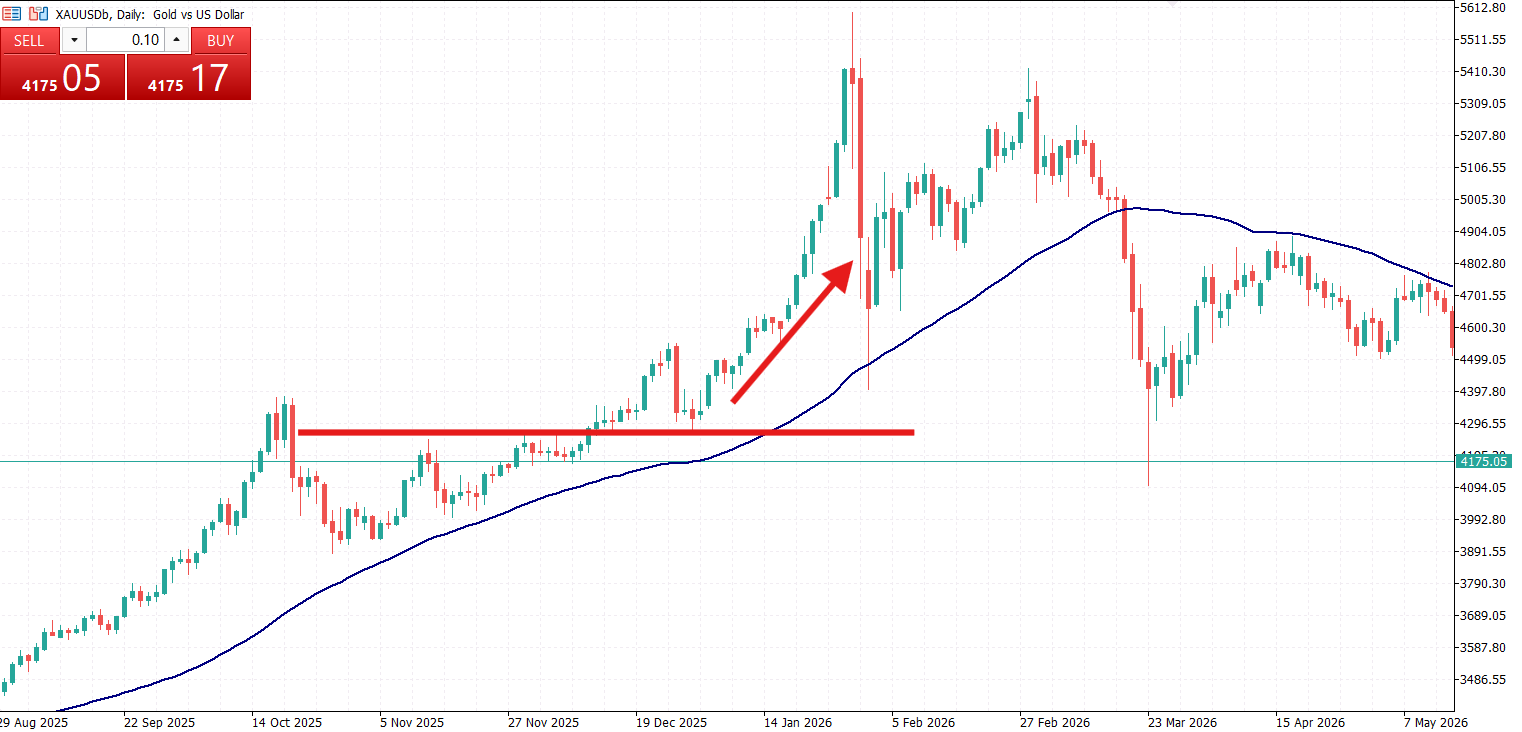
Pay attention to how the price behaves after the breakout. A strong move followed by a successful retest of the broken level can provide more convincing evidence of a reversal.
Be careful with false breakouts. If the price quickly returns below resistance or above support, the original trend may still be intact.
Use Moving Averages to Confirm the Shift
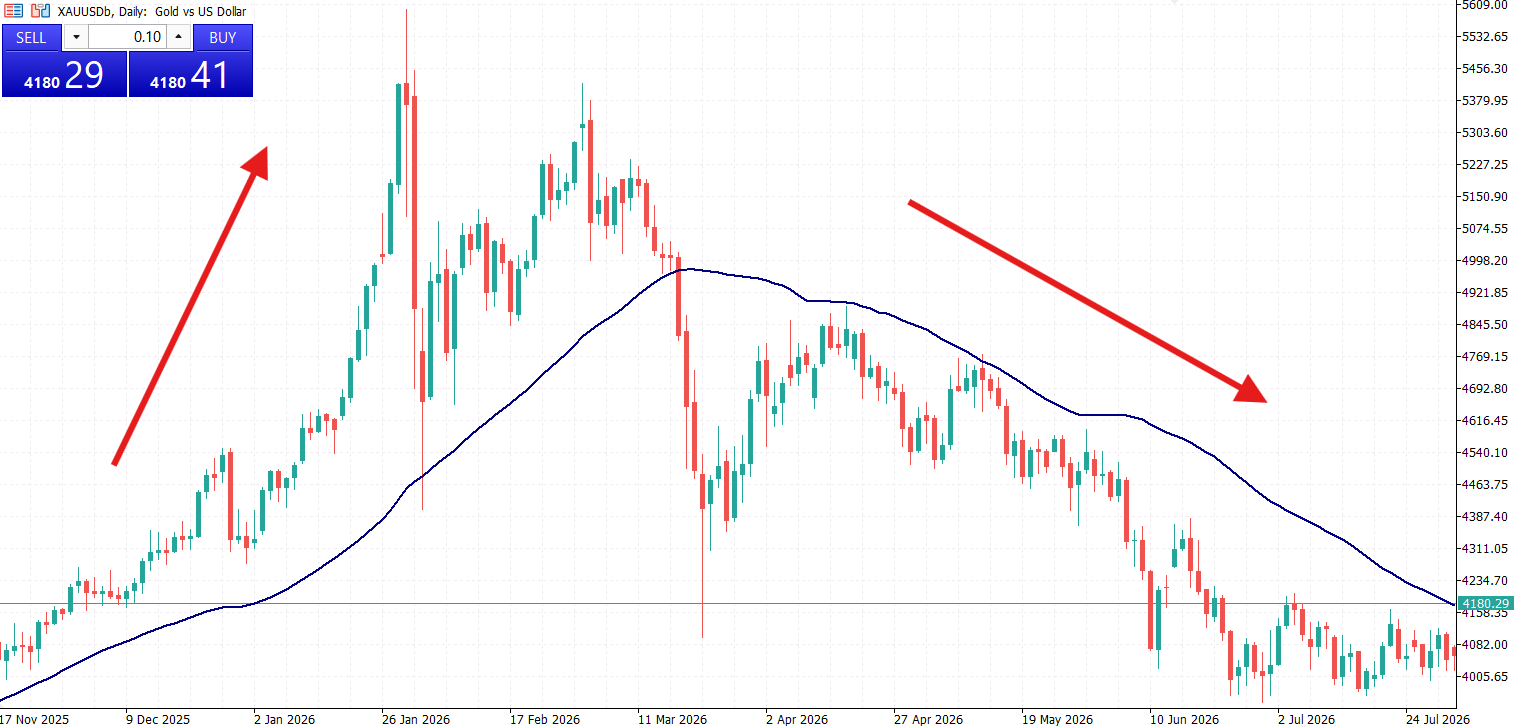
Moving averages help traders identify changes in the broader trend. A price moving above the 50-period moving average may indicate improving momentum. A move below it can signal growing selling pressure. The 200-period moving average is often used to assess the longer-term trend.
Traders also watch for moving average crossovers. For example, when a shorter-term moving average crosses above a longer-term average, it may support a bullish outlook. A downward crossover can suggest a bearish shift.
However, moving averages are lagging indicators. They often confirm a reversal after part of the move has already occurred, so they are best used alongside earlier signals.
Pay Attention to Volume
Volume can help determine whether a potential reversal has meaningful participation behind it. If the price breaks above resistance on rising volume, it may indicate stronger buying interest. A breakdown below support accompanied by increased volume can suggest that selling pressure is building.
By contrast, a breakout on weak volume may be less convincing. Volume should still be interpreted in context, as trading activity varies across markets and asset classes.

How to Confirm a Trend Reversal
The strongest setups often combine several signals rather than relying on a single indicator. For example, a potential bullish reversal may develop when:
- The price stops making lower lows.
- RSI forms a bullish divergence.
- The price breaks above a recent swing high.
- Trading volume increases during the breakout.
The more signals that align, the stronger the case for a reversal. Still, confirmation usually means giving up some of the earliest entry opportunities in exchange for greater confidence.

Final Thoughts
To spot a trend reversal early, focus on changes in price structure, RSI divergence, key support and resistance levels, moving averages, and volume. No single tool provides a reliable signal every time, but combining these techniques can help you recognize potential turning points and make more informed trading decisions.
The goal is not to predict every market move. It is to identify high-quality setups, confirm the evidence, and manage risk when the market does not behave as expected.