
One of the biggest mistakes traders make is relying on a single chart timeframe to identify a trend. A price movement that looks like a strong trend on a short-term chart may simply be a small correction when viewed from a larger perspective.
Multiple timeframe analysis helps traders see the complete market picture. Instead of focusing only on short-term price movements, traders compare different timeframes to understand whether the market direction is truly supported by broader price action.
The main idea is simple: a strong trend should show consistency across different timeframes. When the higher, middle, and lower timeframes point in the same direction, traders have a clearer signal and can avoid many false entries.
Start With the Higher Timeframe
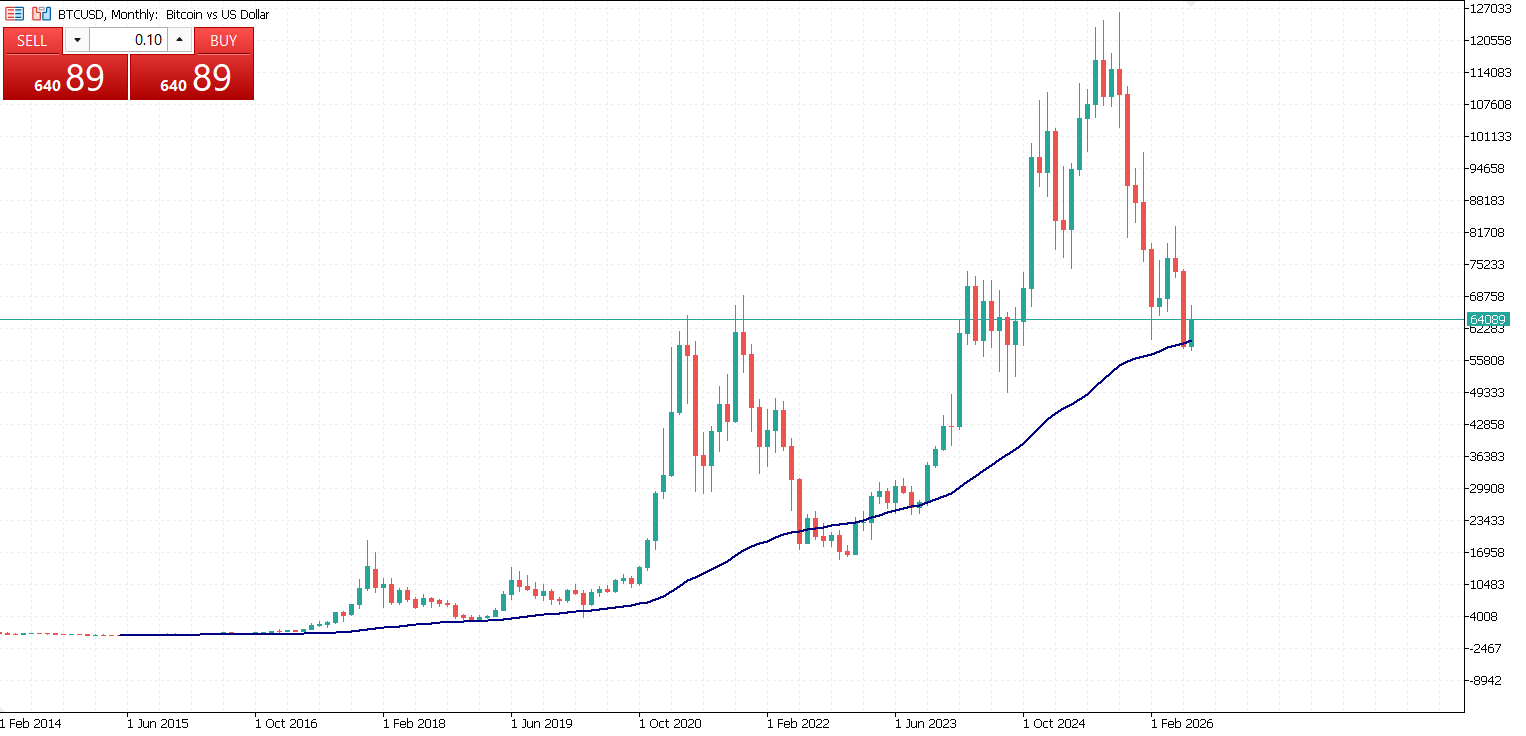
The higher timeframe is where trend analysis begins. It shows the overall market structure and helps determine the dominant direction.
For example, a trader analyzing a stock may start with a weekly chart to understand whether the market is moving upward, downward, or sideways. An uptrend is usually identified by a pattern of higher highs and higher lows, while a downtrend creates lower highs and lower lows.
The higher timeframe should always have the most influence on your decision. Short-term charts can move against the main trend because of temporary volatility, news events, or market noise. A trader who ignores the bigger picture may enter trades that go against the dominant market flow.
Confirm the Trend on the Middle Timeframe
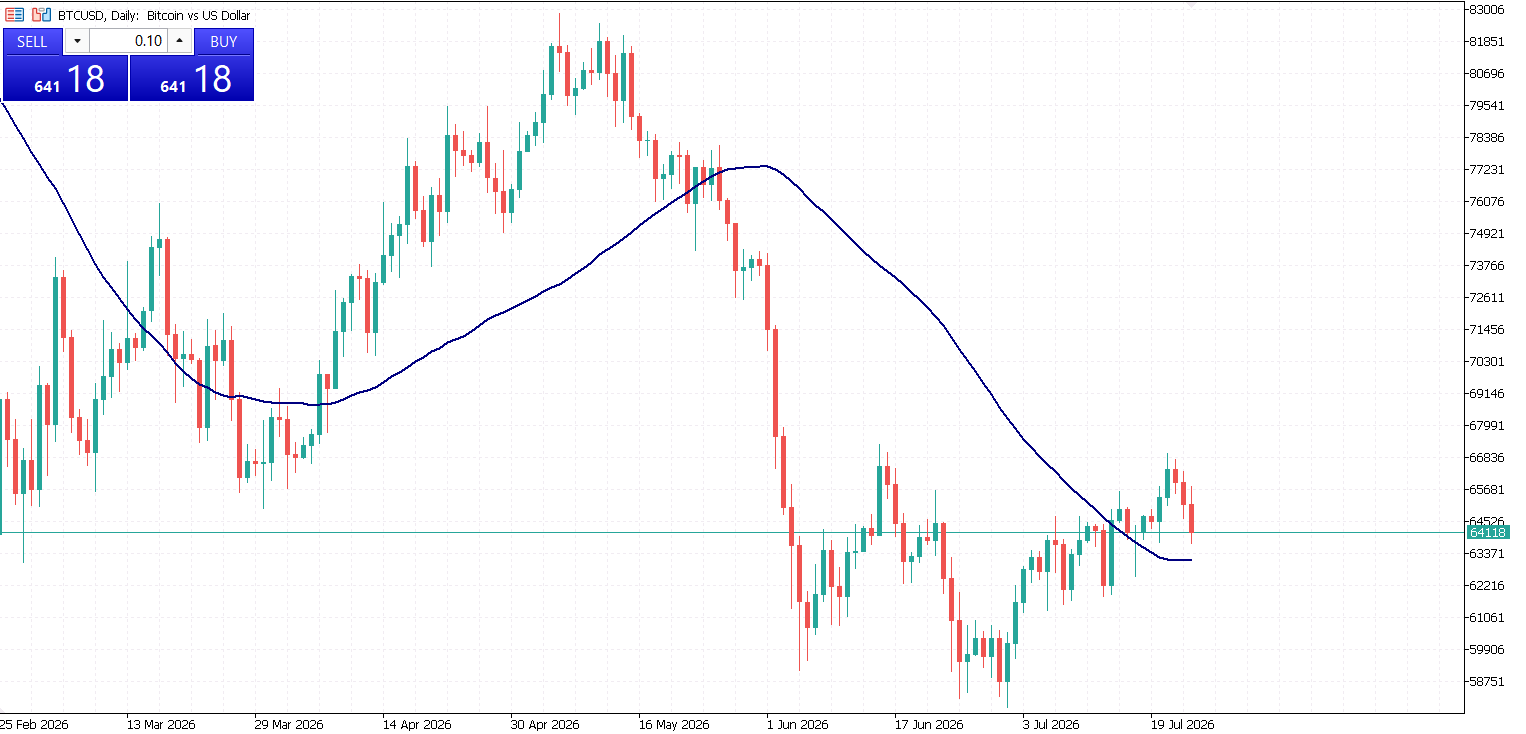
After identifying the main direction, traders move to a middle timeframe to look for confirmation. This timeframe connects the bigger trend with the actual trading setup.
For example, if the weekly chart shows an uptrend, the daily chart should ideally support the same idea. Traders may look for price holding above important support levels, moving averages pointing upward, or continuation patterns that suggest buyers remain in control.
The middle timeframe helps answer an important question: is the current price movement part of the larger trend, or is it only a temporary move? A strong trend usually creates alignment between the higher and middle timeframes. When both charts show similar market behavior, the probability of a reliable setup increases.
Use the Lower Timeframe for Entry Timing
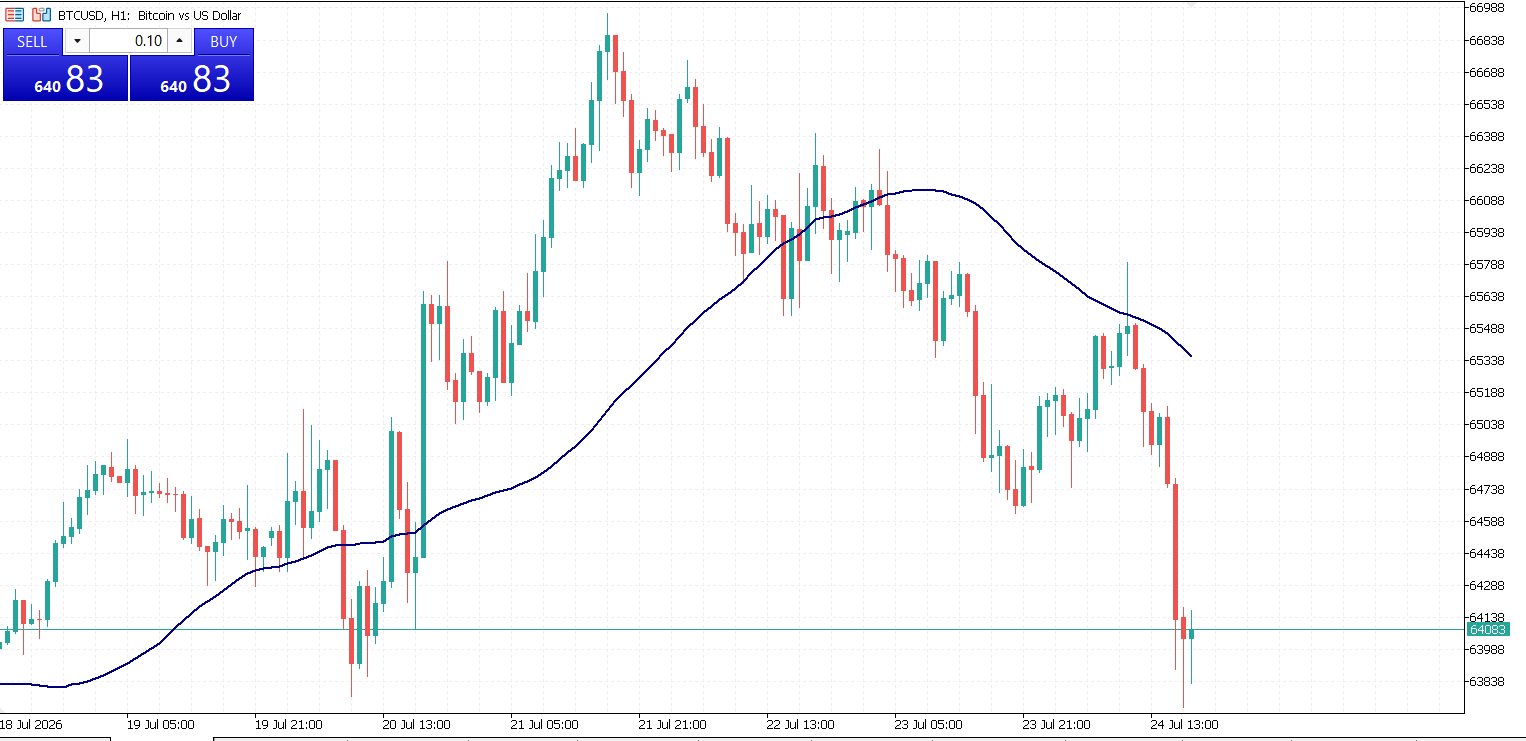
The lowest timeframe is mainly used to find the right entry point. It does not define the overall trend but helps traders improve their timing.
For example, a trader may identify a bullish trend on the weekly chart and confirm it on the daily chart. The 4H chart can then be used to find a pullback, breakout, or reversal pattern that provides an entry opportunity.
Using a lower timeframe without higher timeframe confirmation can lead to poor decisions. Small charts contain more market noise and often create signals that disappear quickly.
The goal is not to predict every short-term movement. The goal is to enter a trade that follows the strongest market direction.

Signs That Multiple Timeframes Agree
When several timeframes support the same trend, traders usually look for confirmation through price structure and technical signals.
- The higher timeframe shows a clear trend with consistent higher highs and higher lows or lower highs and lower lows.
- The middle timeframe confirms the same direction through support levels, trendlines, or indicator alignment.
- The lower timeframe provides an entry signal that follows the larger trend instead of moving against it.
When these conditions appear together, traders can have more confidence that they are trading with the market rather than fighting against it.

Avoid Common Multi-Timeframe Mistakes
One common mistake is giving too much importance to the lowest timeframe. An M5 chart may show several trend changes during the same period when the daily chart still shows a strong and stable trend.
Another mistake is using too many timeframes at once. Looking at multiple charts can create confusion instead of clarity. Most traders only need three timeframes: one for the overall trend, one for confirmation, and one for entry timing.
It is also important to remember that timeframe analysis does not predict the future. Even when multiple charts agree, markets can change direction unexpectedly. Proper risk management remains necessary for every trade.

How Traders Build a Complete Trend Confirmation Strategy
A practical approach is to always move from the biggest timeframe to the smallest. First, identify the dominant market direction. Then confirm that direction on a secondary timeframe. Finally, use a lower timeframe to choose the best entry point.
This process creates a structured trading routine and reduces emotional decisions. Instead of reacting to every price movement, traders can focus on setups that match the larger market trend.
Multiple timeframe analysis works because it combines different perspectives of the same market. The higher timeframe shows where the market is heading, the middle timeframe explains the current situation, and the lower timeframe helps determine when to act.
By learning how to connect these timeframes, traders can improve their trend analysis and make more informed trading decisions.