
Many novice traders often find the concept of oscillators to be complex and bewildering. However, if you’ve decided to venture into trading, it’s crucial to grasp their significance. In this article, I will delve into the best oscillators and explain how to effectively utilize them.
Understanding Oscillators in Technical Analysis
An oscillator is a technical analysis indicator that gauges the speed and direction of price changes in an asset. It is visually represented on a chart as a line that oscillates around a specific level, typically the zero line.
Oscillators rank among the most widely used tools in technical analysis. They serve several essential purposes, including identifying overbought and oversold conditions, pinpointing trends and potential trend reversals, and determining optimal entry and exit points.
Exploring Top Oscillators
Let’s take a closer look at five renowned technical indicators. Each possesses its unique characteristics and advantages, yet all can significantly enhance your trading endeavors.
1. MACD (Moving Average Convergence Divergence)
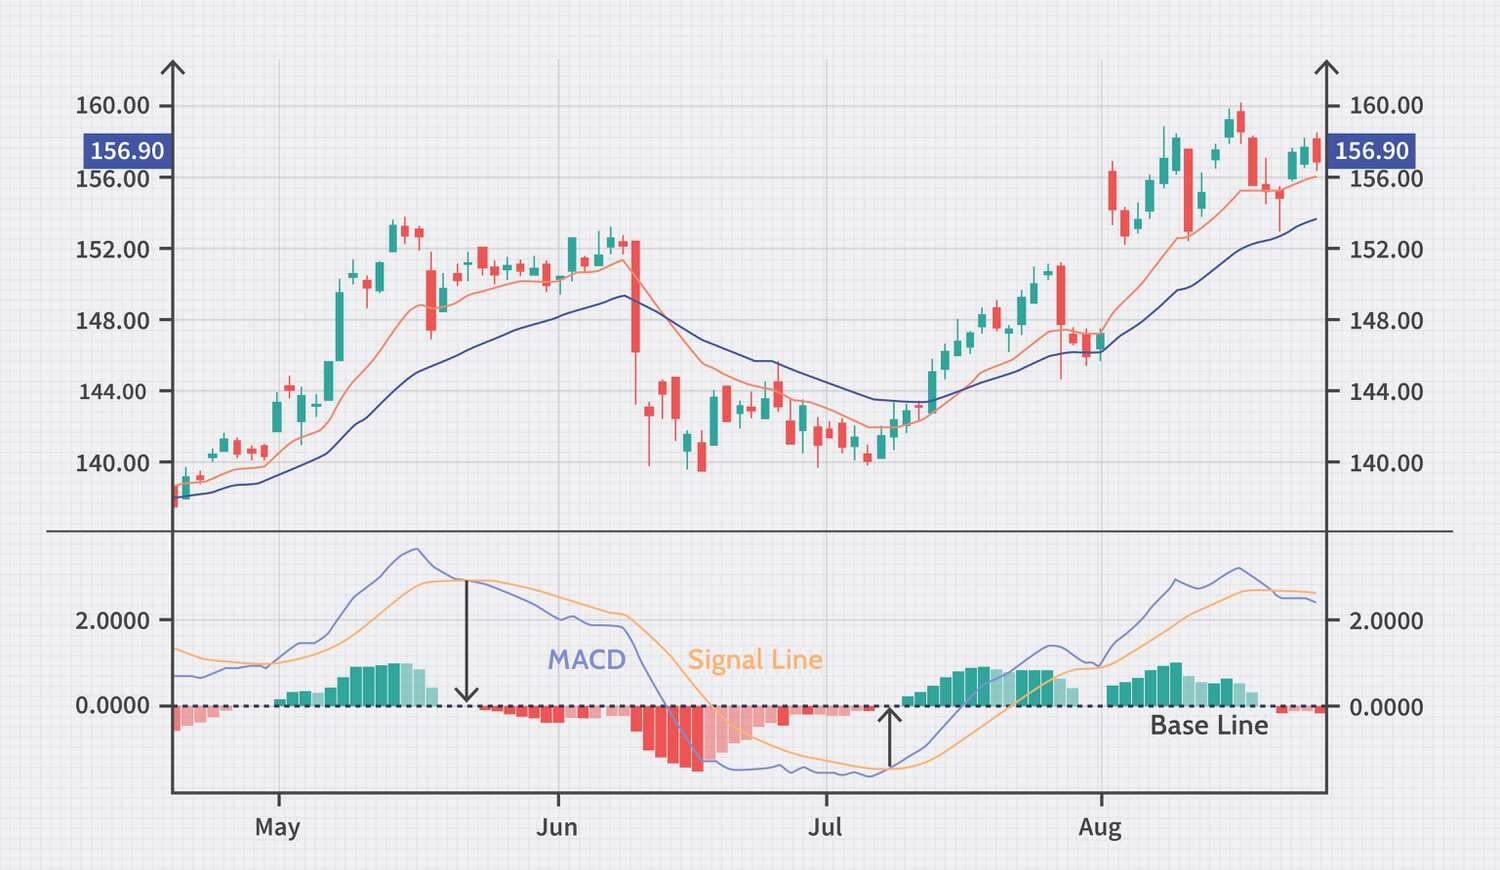
The MACD indicator is one of the most widely used technical analysis tools. It aids traders in identifying the trend direction and its potential shift. The MACD is calculated by subtracting two moving averages (typically the 26-day and the 12-day) and is displayed on the chart as a histogram.
In addition to calculating the two moving averages, the MACD includes a third line called the signal line, typically a 9-day moving average. If the MACD line crosses above the signal line, one might anticipate the start of an upward trend; if it crosses below, a downward trend could be forthcoming.
Furthermore, the MACD can help ascertain whether the market is overbought or oversold. If the MACD reading is significantly above the zero line, it could indicate an overbought market, and if below, an oversold condition.
2. RSI (Relative Strength Index)
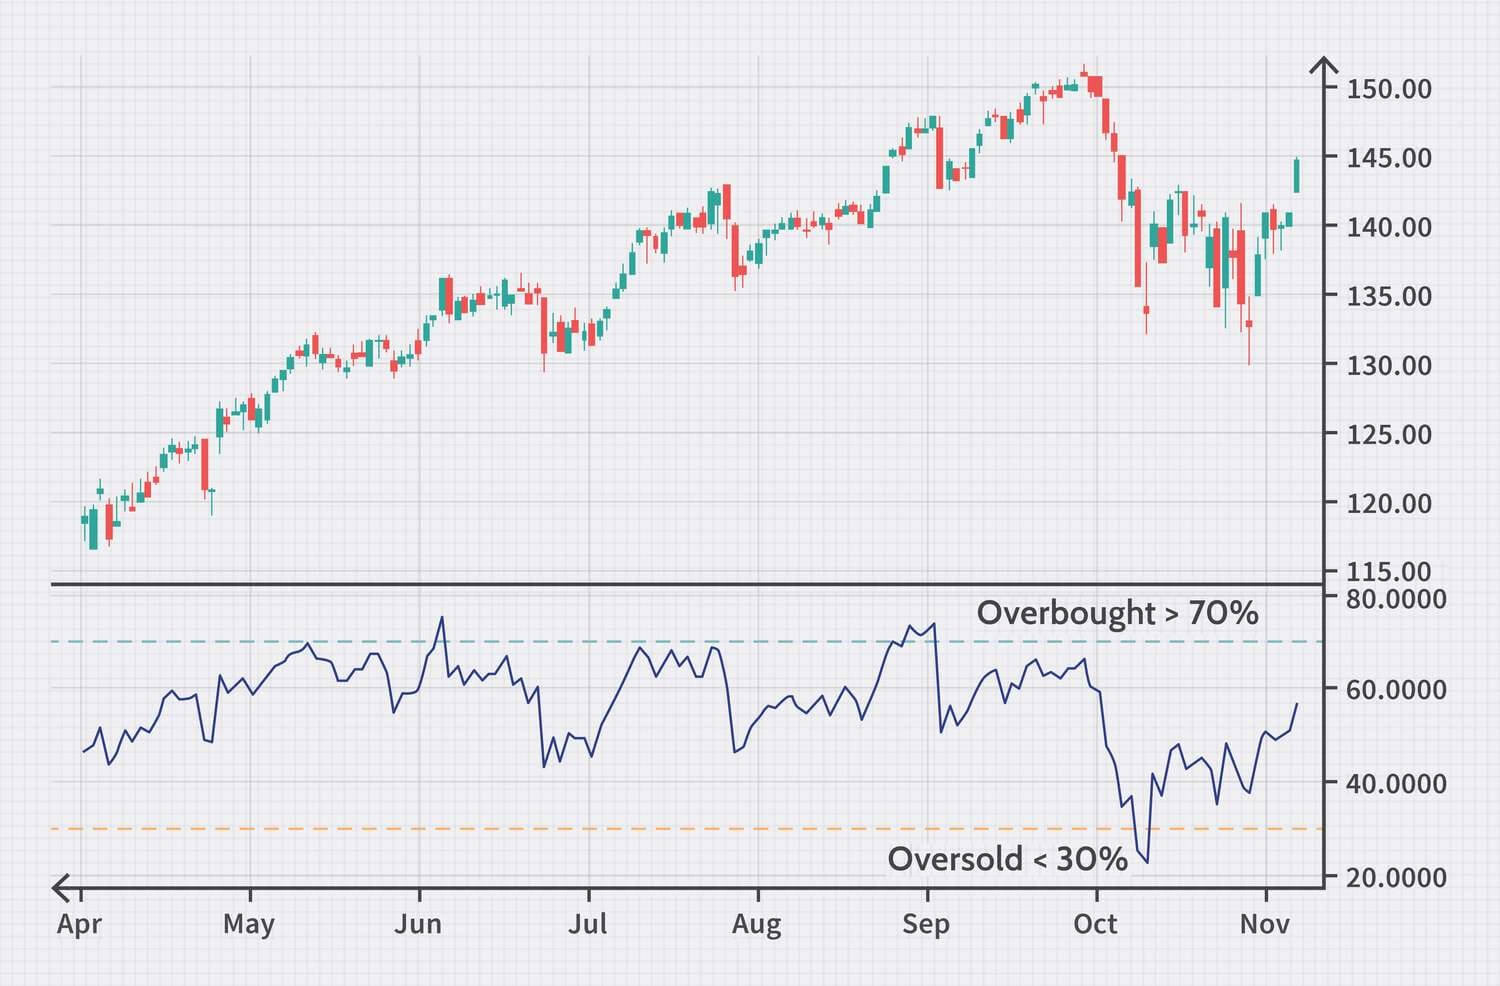
The RSI indicator was designed to measure the strength and direction of price movements in financial markets. It’s used to determine overbought or oversold conditions based on the comparison of the relative strengths of bulls and bears, calculated as the average price increase over a specific period. Typically, a 14-day period is chosen, but it can be adjusted according to personal preferences and specific market characteristics. RSI values range from 0 to 100. When the RSI exceeds 70, it suggests that the market is overbought, and prices might be inflated. Conversely, if the RSI drops below 30, it indicates an oversold market, suggesting that prices might be undervalued.
3. Stochastic Oscillator
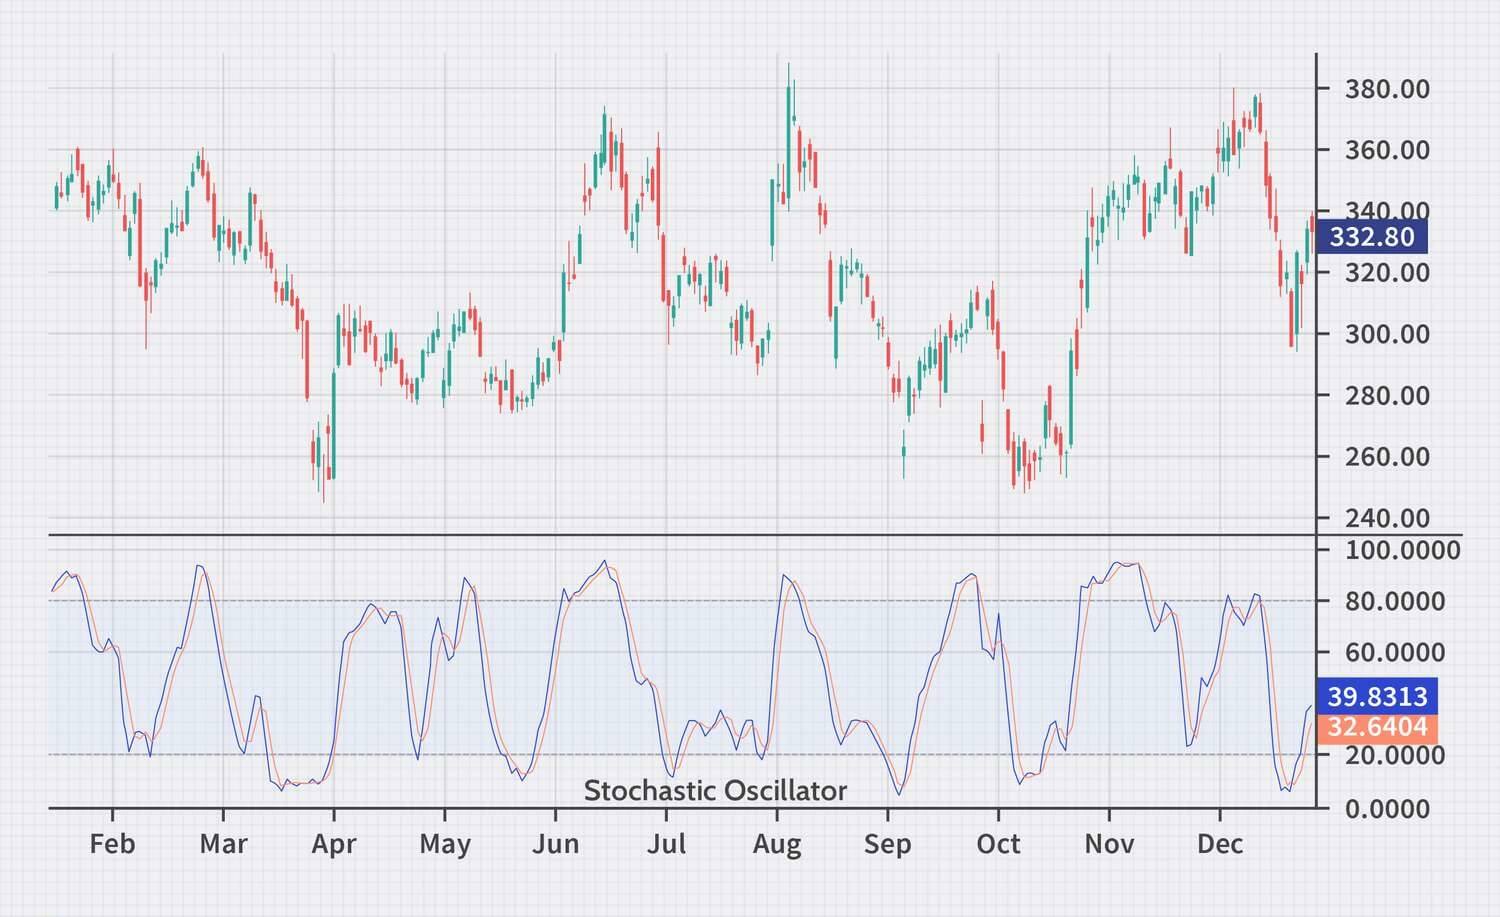
This indicator assists traders in determining the level of relative overbought or oversold conditions of an asset. It consists of two lines: the %K line and the %D line. The %K line represents the current asset price as a percentage of the maximum and minimum prices over a defined period, usually set to 14 days. The %D line is a moving average of the %K line, helping to smooth out fluctuations and provide more accurate signals.
The Stochastic Oscillator typically uses settings of 14,3,3, where the first parameter refers to the period for calculating %K, and the remaining two are for the %D calculation periods. When the Stochastic Oscillator is above 80, it’s often seen as an indication that the asset is overbought, suggesting potential future price drops.
Conversely, when the indicator is below 20, it might indicate the asset is oversold, suggesting a possible price increase. Like other indicators, the Stochastic Oscillator should be used in conjunction with other technical and fundamental analysis tools for more accurate signals. Overall, the Stochastic Oscillator is a potent tool that can aid traders in making decisions in financial markets.
4. ADX (Average Directional Index)
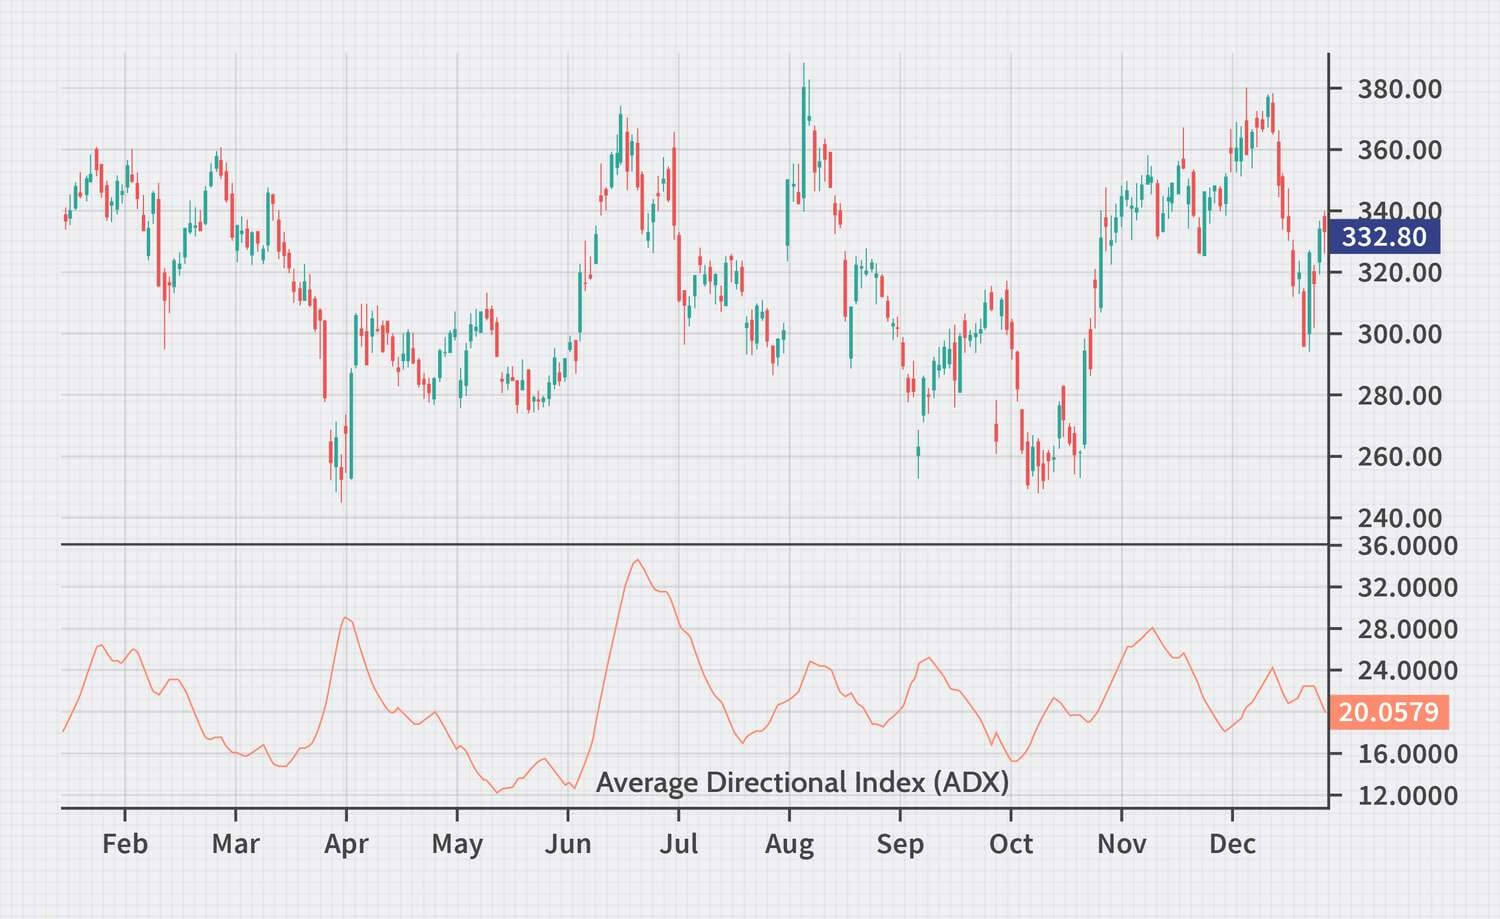
This indicator helps determine the strength and direction of a market trend. It is calculated based on two other indicators – the Directional Movement Index (DMI) and the Directional Movement Index Rating (DMIR). The ADX measures the trend strength based on the difference between the positive and negative values of DMI and DMIR. The ADX line is usually plotted on a chart, oscillating between 0 and 100.
The higher the ADX value, the stronger the trend. An ADX level of 25 is typically used to identify the start of a trend, and an ADX level of 50 indicates a strong trend. If the ADX is above 50, it suggests a very strong trend with a low likelihood of change. If the ADX is below 20, it indicates the absence of a clear trend in the market. Using the ADX assists traders in gauging the strength or weakness of the current market trend, aiding in buy or sell decisions.
5. ROC (Rate of Change)
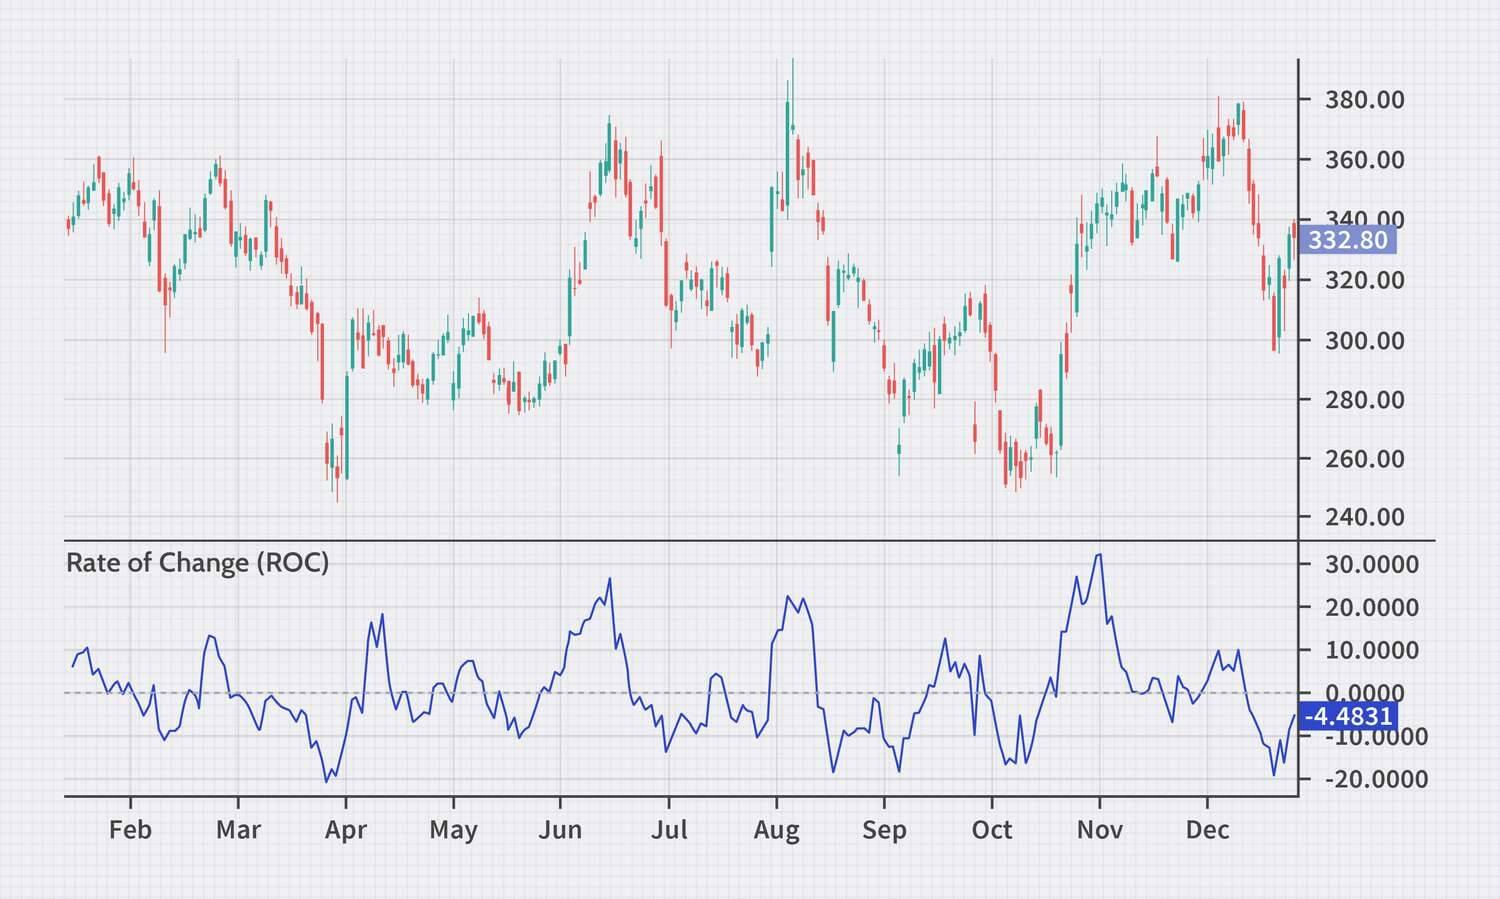
ROC is an oscillator that measures the rate of change in the price of an asset. It is calculated as the ratio of the current price of an asset to the price of the asset N periods ago. The ROC can be positive or negative, depending on whether the asset’s price has increased or decreased over the specified time period. ROC is typically used to identify turning points in price trends. If the ROC is above 0, it may indicate that the asset’s price is rising, and if the ROC is below 0, it suggests that the asset’s price is falling.
The ROC can be expressed as the percentage change in the asset’s price over a specific period. For instance, if the asset’s price was 100 USD 10 days ago and today it’s 110 USD, then the ROC would be 10%.
The ROC can be used to compare different assets to determine which is rising or falling more rapidly. Remember, the ROC, like other oscillators, isn’t a one-size-fits-all tool and should be used in conjunction with other market analysis methods.
Advantages and Disadvantages of Oscillators
Oscillators, including MACD, RSI, Stochastic Oscillator, ADX, and ROC, offer valuable insights for making informed decisions in trading. They help identify overbought and oversold conditions, determine the current trend and its potential reversal, assess market trend strength (in the case of ADX), and pinpoint price trend turning points (with ROC).
However, as with any tool, there are drawbacks to consider. Oscillators are not infallible and can produce false signals, particularly during market volatility. They may prove less effective in sideways markets characterized by narrow price ranges. Accurate interpretation of oscillator signals demands skill and experience. Additionally, oscillators can falter in specific market conditions, such as high volatility or low liquidity. Overreliance on oscillators alone may also lead to neglecting other critical factors, such as news and events that impact asset prices.

How to Enhance Oscillator Performance?
To enhance the performance of oscillators, consider implementing the following methods:
- Combine Multiplsuch as high volatility or low liquiditye Oscillators: Pairing different oscillators with other indicators can provide a more comprehensive view of market conditions. For example, using RSI and the Stochastic Oscillator in conjunction with Moving Averages can help identify strong trends and overbought/oversold conditions.
- Use different periods: Tailor the periods of oscillators to align with your specific trading strategy. Shorter periods are often suitable for short-term strategies, while longer periods may be more beneficial for longer-term approaches.
- Apply Filters: Implement filters to reduce false signals. For instance, you can use a moving average to confirm the signals generated by an oscillator.
- Diversify Analysis: Avoid relying solely on a single oscillator when making trading decisions. It’s essential to analyze price charts and consider other indicators such as trading volume and support/resistance levels to gain a more comprehensive understanding of market dynamics.
In conclusion, I hope this overview has helped you grasp the concept and purpose of oscillators better. As a further recommendation, I suggest reading “Technical Analysis of the Financial Markets” by John Murphy. This resource provides valuable insights into how oscillators function and can help you refine your technical analysis skills. Best of luck in your financial market endeavors!


