
Success in the financial markets depends not just on instinct or experience, but on using the right tools at the right time. Technical indicators, when chosen and applied wisely, can provide valuable insights that enhance trading decisions across all styles, from day trading to long-term investing. While no indicator holds all the answers, combining them strategically can significantly improve your market analysis and strengthen your overall strategy.
In this article, we’ll explore five of the best and most widely used trading indicators. We’ll explain what they are, how they work, and how you can use them to enhance your trading decisions. Whether you’re a beginner looking to understand the basics or a seasoned trader refining your edge, this guide will help you use indicators with greater confidence and precision.
1. Relative Strength Index (RSI)
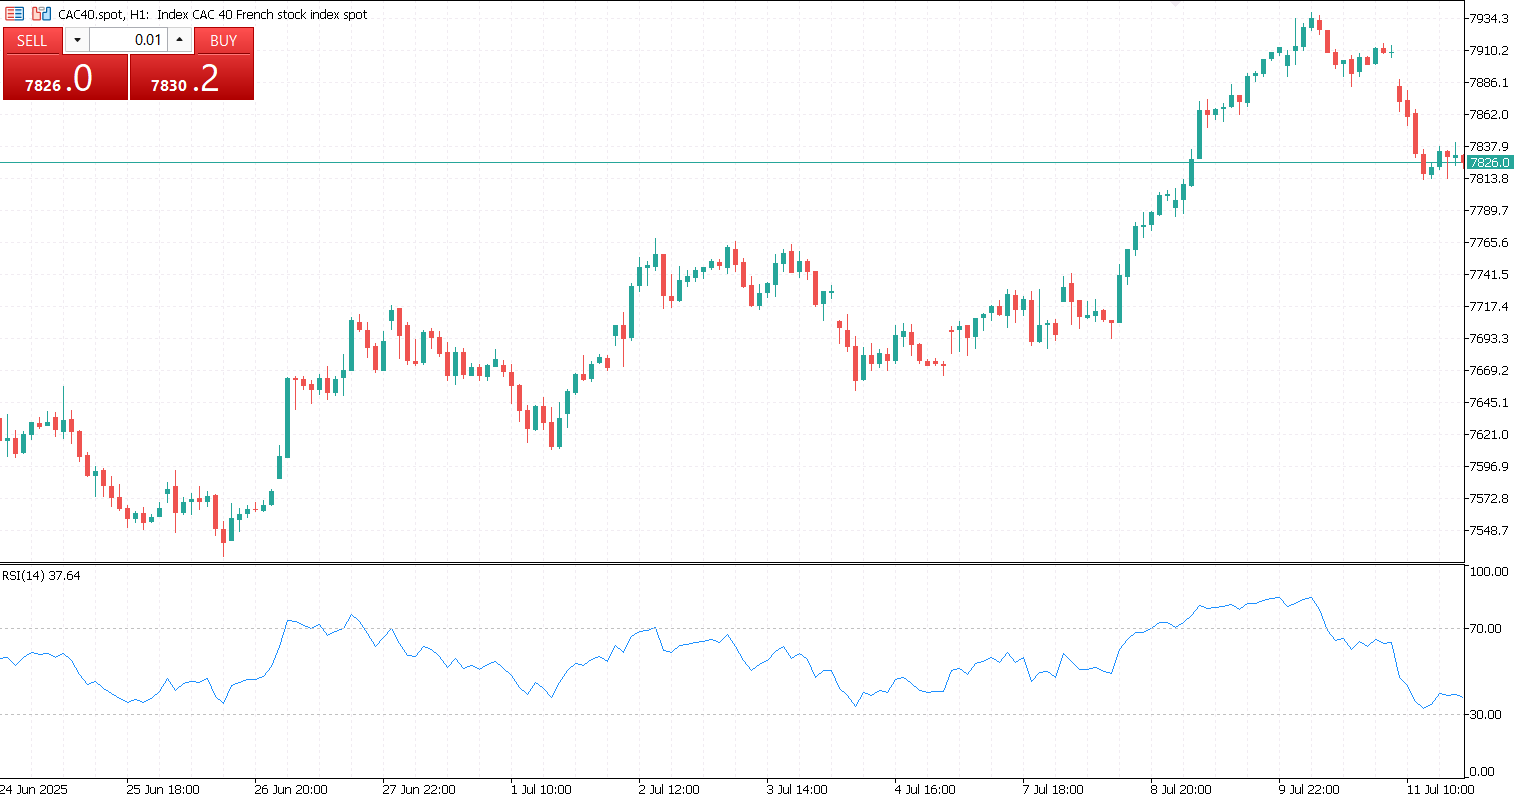
The Relative Strength Index (RSI) is a momentum indicator developed by J. Welles Wilder that helps traders understand the strength and speed of a market’s price movements. It’s a technical tool that ranges from 0 to 100 and is commonly used to identify whether an asset is potentially overbought or oversold. By analyzing recent price changes, RSI provides insights into whether current trends might be losing steam.
Typically, when RSI rises above 70, it suggests that an asset could be overbought, meaning its recent gains may have been too rapid or excessive. This can hint at a possible price correction. On the other hand, an RSI reading below 30 often signals that the asset might be oversold, implying it has dropped too quickly and could be due for a rebound. These levels help traders anticipate potential reversals or slowdowns in the market.
Traders use RSI to help time their entries and exits. For example, a rising RSI after falling below 30 can suggest a buying opportunity, while a falling RSI after crossing above 70 may indicate it’s time to sell or take profits. However, RSI is most effective when used alongside other tools like support and resistance levels or trendlines. In strong trends, RSI can remain in overbought or oversold territory for extended periods, so understanding market context is essential for making smart decisions.
2. Moving Averages (SMA & EMA)
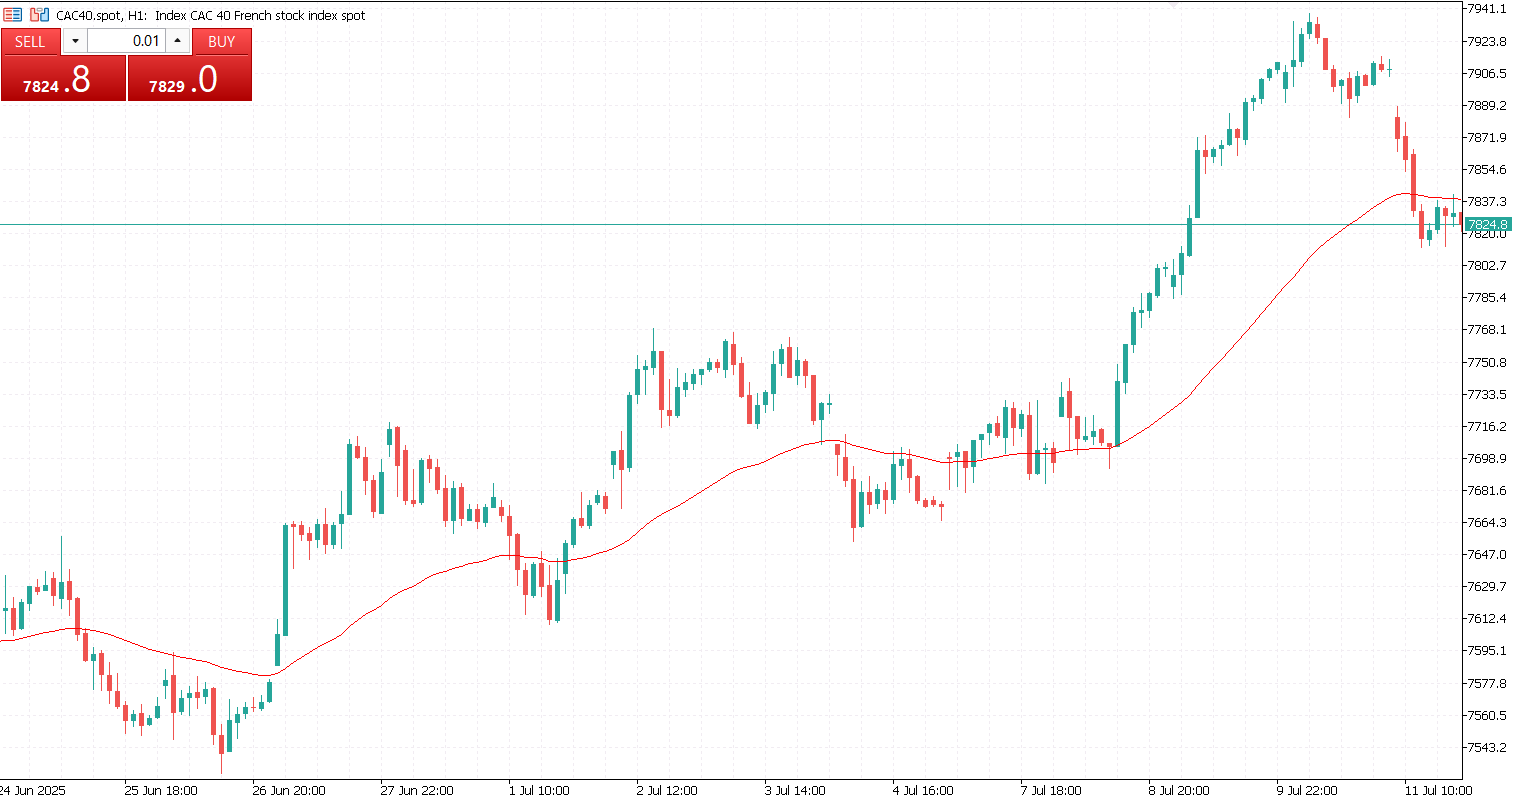
Moving averages are used by traders to smooth out price data and better identify market trends. By averaging past prices, they help reduce short-term noise and highlight the underlying direction of an asset. The two most commonly used types are the Simple Moving Average (SMA), which calculates the average price over a set period, and the Exponential Moving Average (EMA), which gives more weight to recent prices and reacts more quickly to market changes.
The direction of a moving average can provide clues about the trend: if it’s rising, it often indicates an uptrend, while a falling moving average points to a downtrend. Traders also look at crossovers for potential signals. For example, when a short-term moving average crosses above a long-term one, it can suggest a buying opportunity, while the opposite crossover may signal a sell. These crossovers are known as the “Golden Cross” and “Death Cross,” respectively, and are especially popular for analyzing long-term market direction.
Different timeframes are used depending on the trading strategy. Long-term traders might rely on the 50-day and 200-day SMAs to gauge overall trends, while short-term traders often prefer the 9-day and 21-day EMAs for quicker signals. Beyond identifying trends, moving averages can also act as dynamic support or resistance levels, especially when viewed on higher timeframes, offering traders additional guidance on where price might react.
3. MACD (Moving Average Convergence Divergence)
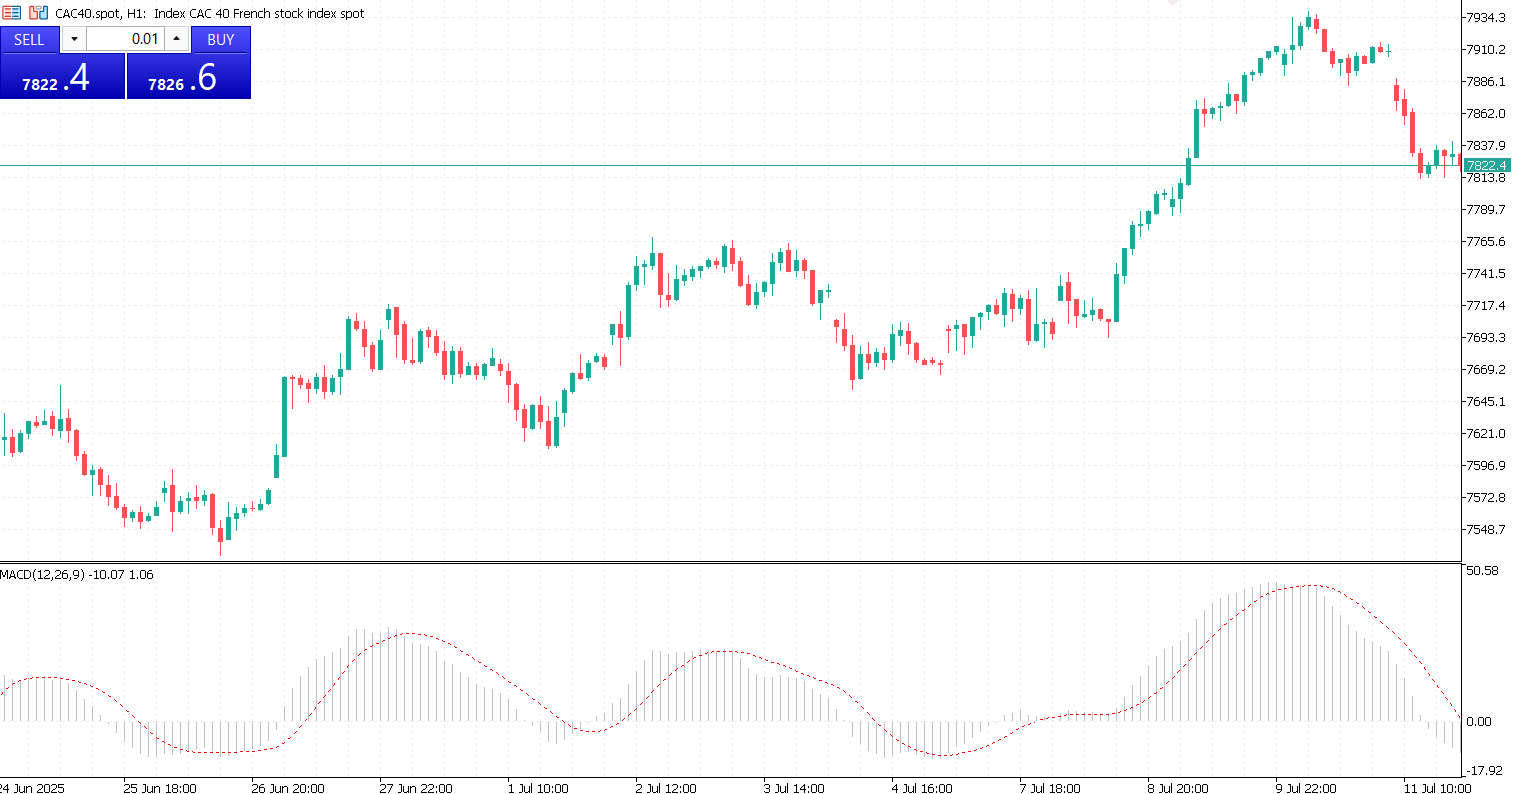
The Moving Average Convergence Divergence (MACD) is a trend-following momentum indicator that reveals the relationship between two moving averages of an asset’s price. Developed by Gerald Appel in the late 1970s, MACD helps traders identify changes in strength, direction, momentum, and duration of a trend. It’s a widely used tool because it combines elements of both trend-following and momentum indicators.
MACD is created by subtracting the 26-period Exponential Moving Average (EMA) from the 12-period EMA. The result is the MACD line. A 9-period EMA of this MACD line, known as the signal line, is then plotted alongside it. When the MACD line crosses above the signal line, it typically indicates bullish momentum, while a cross below suggests bearish momentum. These crossover points are often used to spot potential trend reversals or changes in momentum.
Traders also use the MACD histogram, which visually represents the difference between the MACD line and the signal line. Growing bars on the histogram can signal increasing momentum, either upward or downward. To improve accuracy and avoid false signals, MACD is often combined with volume analysis or key aspects of price action, offering a more complete view of market dynamics.
4. Bollinger Bands
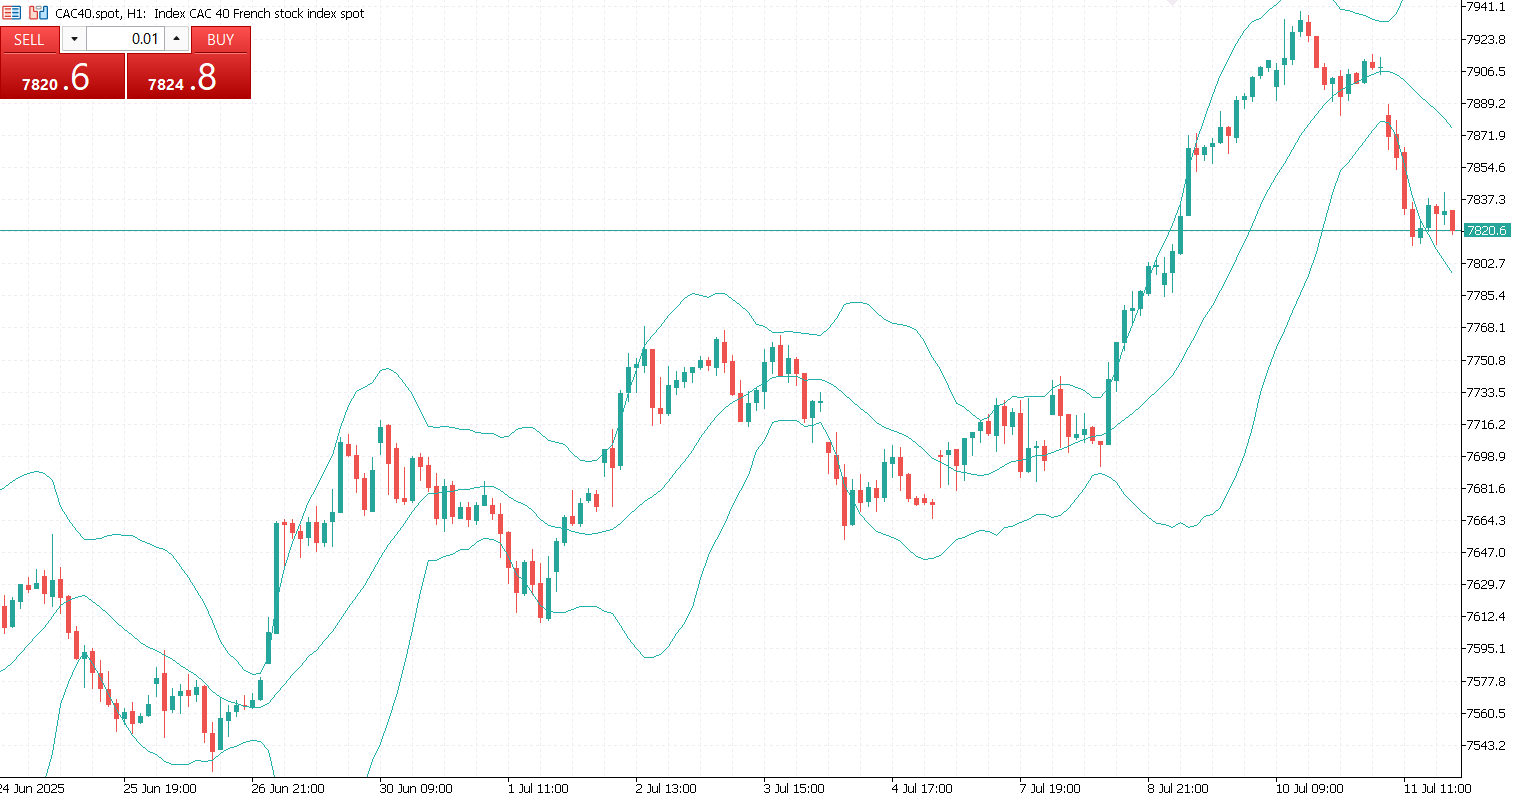
Bollinger Bands are a technical analysis tool developed by John Bollinger that help traders assess market volatility and potential price extremes. The indicator consists of three lines: a middle band, which is typically a 20-period Simple Moving Average (SMA), and two outer bands that are placed two standard deviations above and below the middle line. These bands dynamically adjust based on price volatility, expanding during volatile periods and contracting when the market is quiet.
When the price moves toward the upper band, it may indicate that the asset is becoming overbought, while movement toward the lower band can suggest it is oversold. Because of this, Bollinger Bands are often used to spot potential reversal points. Traders also observe how the price behaves around these bands to anticipate changes in market direction. For instance, in a mean-reverting market, the price tends to return to the middle band after touching the upper or lower band.
Besides identifying overbought and oversold conditions, Bollinger Bands are useful in breakout and trend-following strategies. When the bands tighten, indicating low volatility, it often signals that a sharp price movement may be coming. In strong trends, the price can consistently touch or ride along the outer bands. For best results, traders often combine Bollinger Bands with other indicators like RSI or MACD to confirm signals before making a trade.
5. Volumes
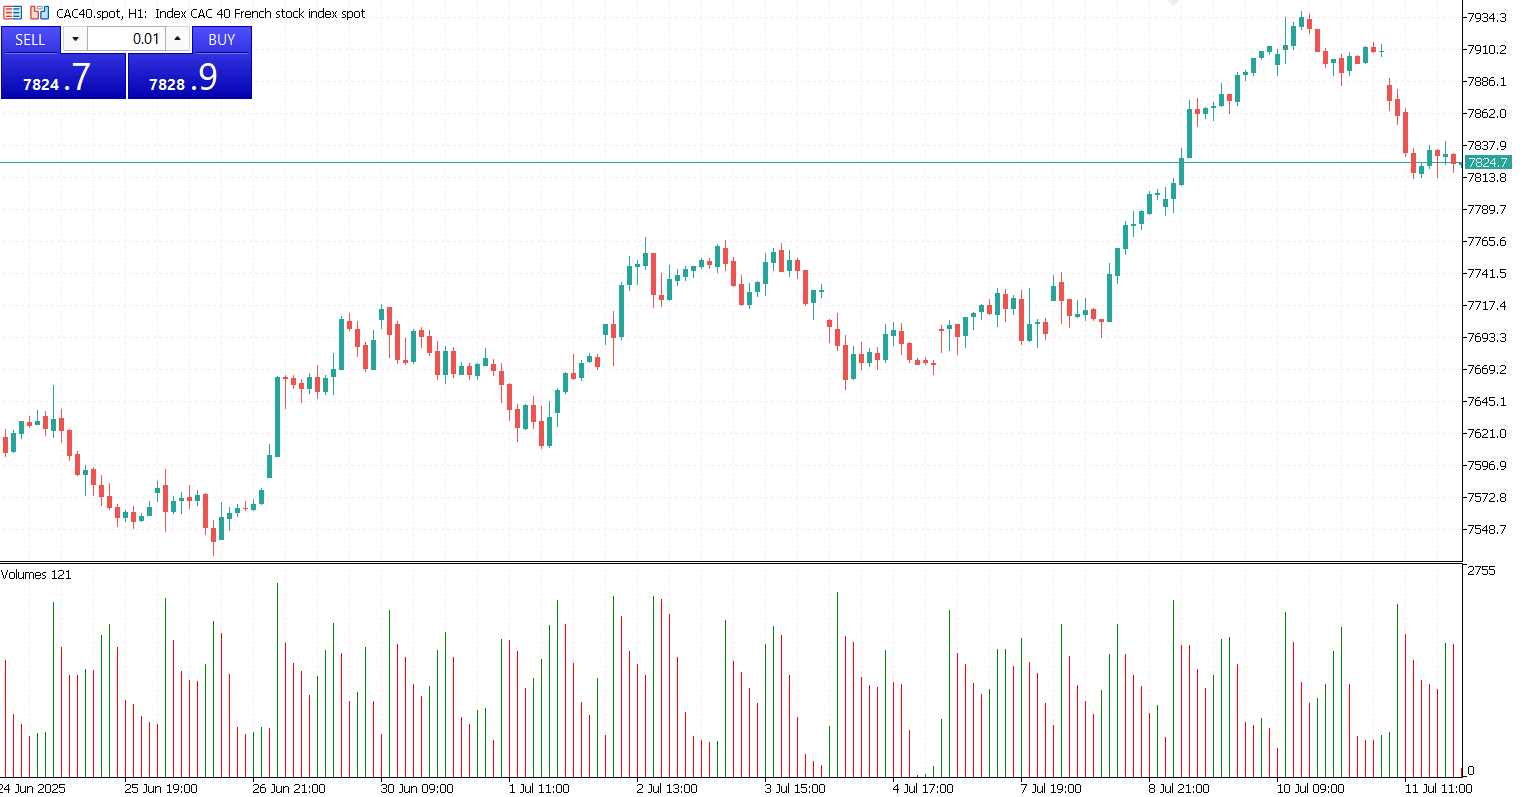
Volumes is a core technical indicator that shows the number of shares, contracts, or units traded during a specific period of time. It provides insight into the strength or weakness of a price move by reflecting how much interest or activity there is in the market. High volume typically means strong interest and can confirm trends or breakouts, while low volume may suggest a lack of conviction or the possibility of a reversal.
This indicator is displayed as vertical bars at the bottom of a price chart, with each bar representing the volume for that time period, whether it’s one minute, one day, or longer. A sudden spike in volume can signal that a major move is underway, especially if it coincides with a breakout from a support or resistance level. Conversely, if prices are rising or falling but volume is shrinking, it may indicate the move is losing strength.
Volume becomes even more powerful when used alongside price action and other indicators. For example, volume divergence, where price moves in one direction but volume does not support it, can be an early warning of a potential reversal. Additionally, combining volume with patterns like breakouts or candlestick formations can help traders confirm entry and exit points with greater confidence.
Technical indicators are essential tools in a trader’s arsenal, but they are not foolproof. No indicator can predict the future with 100% accuracy. The key is to use them in combination, understand their limitations, and always consider the broader market context.
Start simple. Learn how each indicator works, backtest your strategy, and gradually incorporate more tools as you gain experience. Remember: the best traders don’t rely on a single indicator, they build systems based on confluence and discipline.


