
The shooting star candlestick pattern is one of the most recognized reversal patterns in technical analysis. It helps traders identify potential resistance levels and entry points for short positions. Understanding this pattern can enhance trading strategies and increase profitability by signaling when an uptrend is weakening and a reversal might be imminent.
The shooting star pattern is characterized by a small real body at the lower end of the price range and a long upper shadow. It indicates that buyers attempted to push the price higher, but sellers regained control, bringing the price back near its opening level. When identified correctly, this pattern can be a useful tool for traders to predict trend reversals and act accordingly.
Understanding the Shooting Star Pattern
A shooting star appears after an uptrend and signals a potential reversal. It typically has a small body at the lower end of the range, a long upper shadow, and little to no lower shadow. This formation shows that buyers initially had control, but strong selling pressure pushed the price back down, weakening the uptrend and increasing the likelihood of a bearish reversal.
For the pattern to be more bearish, it should appear at a key resistance level and be followed by additional confirmation, such as a bearish candlestick or a breakout below a trendline. High trading volume during the formation also strengthens the signal. Conversely, a bullish shooting star, also known as an inverted hammer, can appear at the bottom of a downtrend and indicate a potential reversal when followed by a bullish confirmation.
How to Identify a Shooting Star Pattern
To spot a shooting star, traders must first identify an uptrend or a local price peak. The pattern is more reliable when it forms after a strong bullish move. Confirmation is necessary, typically in the form of a bearish breakout below a key support level or additional bearish patterns such as bearish engulfing or dark cloud cover.
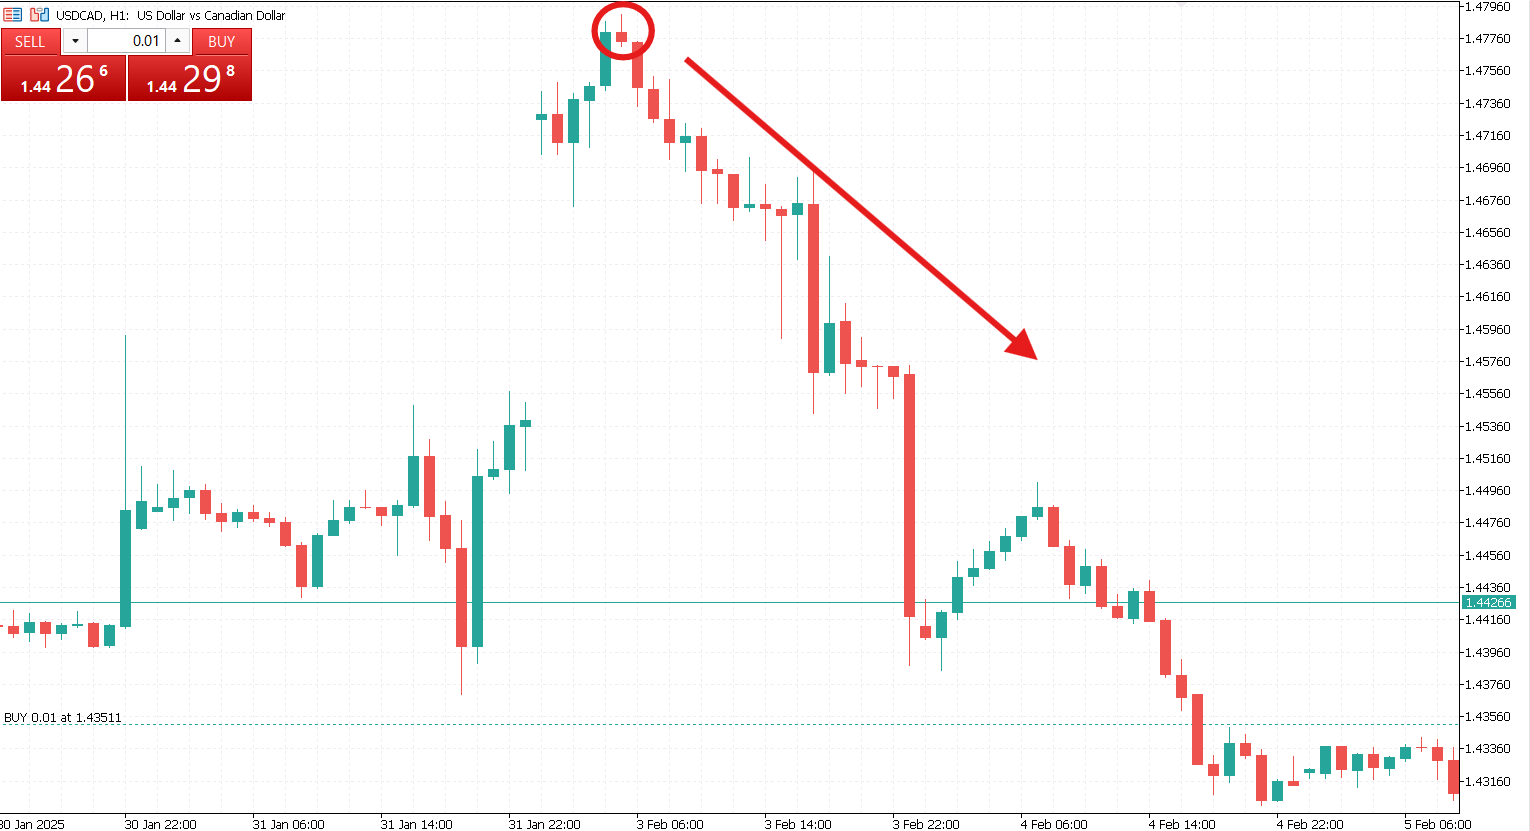
Key characteristics of a shooting star:
- Small body at the lower end of the candle range.
- Long upper shadow, at least twice the size of the body.
- Little to no lower shadow.
- Appears after an uptrend.
- Often signals a bearish reversal, especially when confirmed by other patterns.
The Psychology Behind the Shooting Star Pattern
Understanding the psychology behind the shooting star pattern helps traders make informed decisions. When an asset is in an uptrend, traders expect the price to continue rising. However, when a shooting star forms, it shows that buyers attempted to push the price higher but met strong resistance. The long upper shadow represents the failed attempt to sustain higher prices, which causes uncertainty in the market.
This shift in sentiment leads to increased selling pressure, and if the following candle confirms the reversal, traders may enter short positions, anticipating further decline. The shooting star pattern is particularly effective when observed at historically significant resistance levels, as these areas tend to attract profit-taking and short-selling activity.

Trading Strategies for the Shooting Star Pattern
When trading a shooting star, it is essential to determine entry and exit points carefully. If the pattern appears near resistance, traders should watch for further signs of a downturn before entering a short position. More conservative traders may wait for a confirmed breakout, while aggressive traders might enter immediately.
Steps to trade a shooting star:
- Identify an uptrend and a strong bullish movement.
- Spot the shooting star pattern at a resistance level.
- Wait for confirmation, such as a bearish candle or a breakout below a trendline.
- Enter a short position after confirmation.
- Place a stop-loss above the high of the shooting star to limit potential losses.
- Set profit targets at the nearest support level or use a trailing stop-loss strategy.
Common Mistakes When Trading the Shooting Star Pattern
While the shooting star pattern can be a valuable tool, traders often make mistakes when using it. Understanding these common pitfalls can help avoid costly errors.
Common mistakes include:
- Ignoring confirmation signals. A shooting star should not be traded in isolation. Without confirmation from other technical indicators or price action, the signal may be unreliable.
- Entering trades too early. Impatient traders may enter short positions immediately after spotting the shooting star without waiting for a follow-up bearish candle.
- Misidentifying the pattern. Traders sometimes confuse other candlestick formations with the shooting star. It is essential to verify all characteristics before making a trade.
- Neglecting market conditions. The effectiveness of the shooting star pattern depends on the overall market trend and volatility. It is less reliable in sideways markets with no clear trend.
- Placing stop-loss orders too close. Setting stop-loss levels too close to the entry point may result in getting stopped out due to normal market fluctuations.

Strengths and Weaknesses of the Shooting Star Pattern
The shooting star pattern has distinct advantages and limitations that traders should consider.
Strengths:
- Easy to identify, making it useful for beginners.
- Provides a clear indication of potential reversals.
- Works well in conjunction with other technical indicators.
- Can help traders set precise stop-loss and take-profit levels.
Weaknesses:
- Can produce false signals, especially in low volatility markets.
- Requires confirmation for reliability.
- Less effective if not supported by additional technical analysis.
The shooting star candlestick pattern is a valuable tool for identifying potential reversals in the market. While it can provide strong trading signals, confirmation from other technical indicators is necessary to increase accuracy. By understanding how to recognize and trade the pattern, traders can improve their decision-making and enhance their overall market strategy. Proper risk management and careful observation of price action are crucial to maximizing the effectiveness of this pattern in trading.
By integrating the shooting star pattern with other technical analysis methods such as trendlines, support and resistance levels, and momentum indicators, traders can improve their overall market analysis and make more informed trading decisions.


