
Traders use a variety of indicators to forecast potential price movements and spot opportunities in the markets. One of the most trusted and widely used indicators is the Relative Strength Index (RSI). Developed by J. Welles Wilder, RSI measures the speed and change of price movements and is primarily used to identify overbought or oversold conditions.
However, one of the more advanced applications of the RSI is the detection of divergences, which can be powerful signals of upcoming trend reversals or momentum shifts. This article will explore the concept of RSI divergence in depth, what it is, how to spot it, and how traders use it to enhance their strategies.
What Is RSI?
The Relative Strength Index is a momentum oscillator that ranges between 0 and 100. Typically, an RSI reading above 70 suggests an asset is overbought, while a reading below 30 suggests it is oversold. Traders use this information to assess whether a security’s price has moved too far in either direction and may be due for a correction.
But beyond simply identifying extremes, RSI can also show divergence from price action, indicating potential weakness in a current trend and alerting traders to possible reversals.
What Is RSI Divergence?
RSI divergence occurs when the price of an asset and the RSI indicator move in opposite directions. This mismatch suggests that momentum does not support the current price trend, hinting at a possible reversal.
There are two primary types of RSI divergence:
- Bullish Divergence. Occurs when the price makes lower lows, but the RSI makes higher lows. This suggests that although the price is falling, the selling pressure is weakening, potentially setting the stage for a bullish reversal.
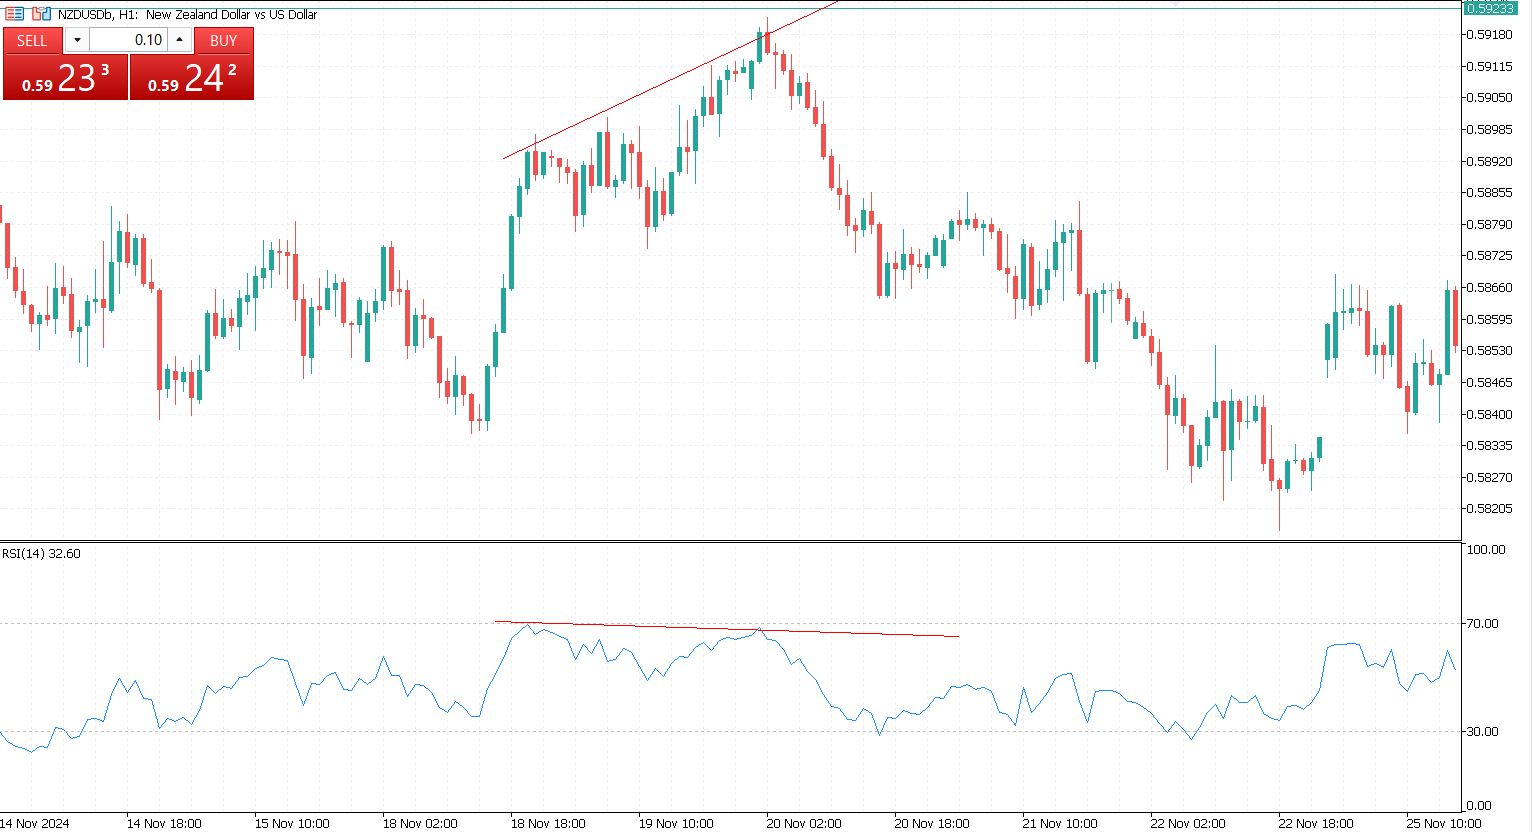
- Bearish Divergence. Happens when the price makes higher highs, but the RSI makes lower highs. This indicates waning buying pressure despite rising prices and may signal an impending bearish reversal.
Regular vs. Hidden Divergence
In addition to the basic bullish and bearish divergences, traders also differentiate between regular and hidden divergence. Regular divergence typically signals a potential trend reversal, while hidden divergence suggests that the existing trend is likely to continue.
A regular bullish divergence occurs when the price forms lower lows, but the RSI indicator shows higher lows. This suggests that although the price is declining, the downward momentum is weakening, indicating a possible reversal to the upside.
Conversely, a regular bearish divergence appears when the price makes higher highs, but the RSI forms lower highs. This signals weakening buying momentum, which may lead to a reversal to the downside.
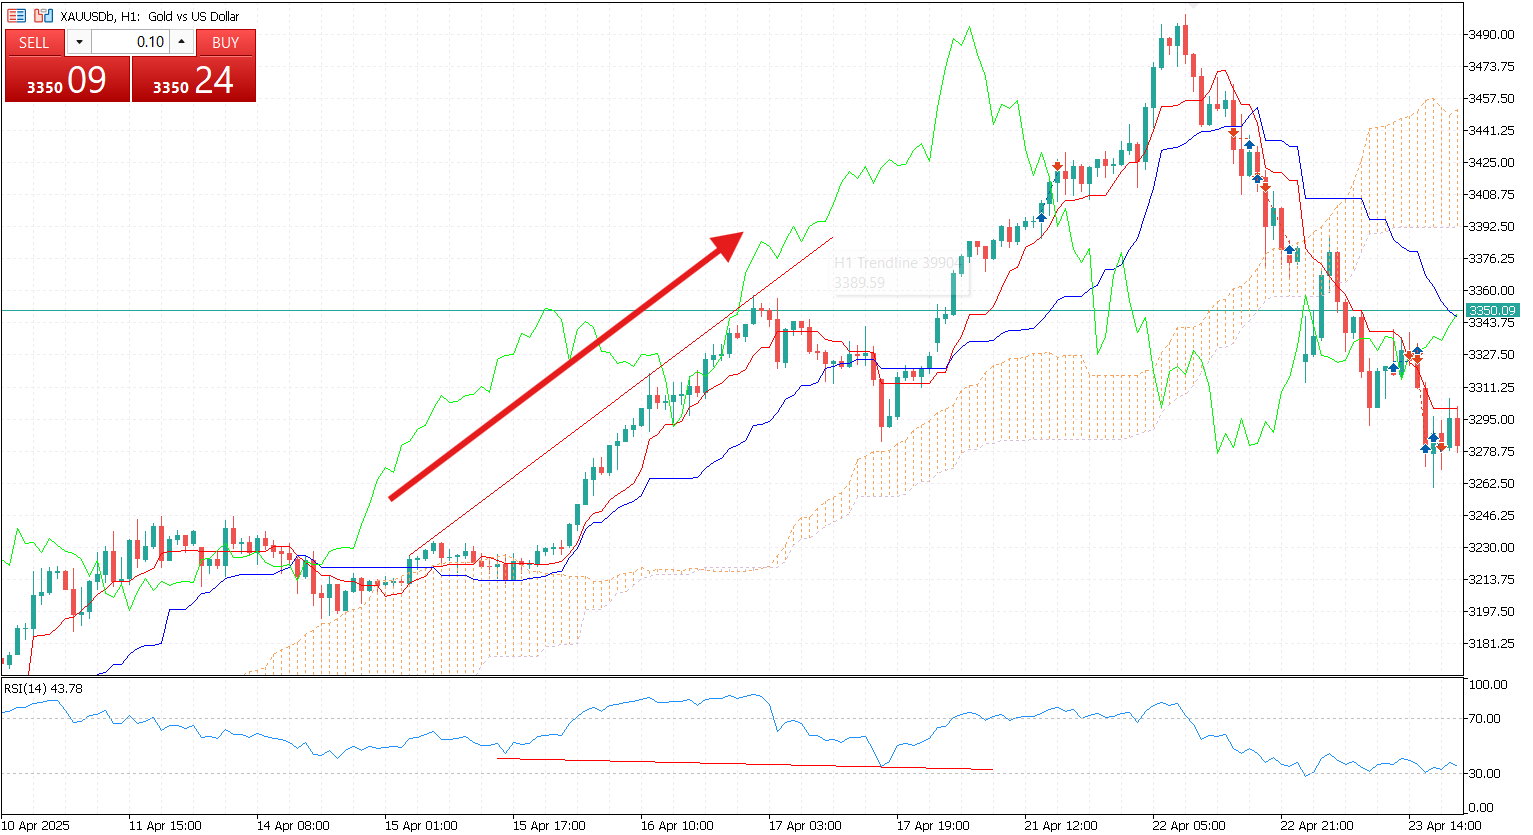
Hidden divergence, on the other hand, points to a continuation of the current trend. A hidden bullish divergence is identified when the price forms higher lows, but the RSI makes lower lows. This indicates that, despite a short-term dip in momentum, the overall uptrend remains strong.
A hidden bearish divergence is seen when the price makes lower highs, but the RSI shows higher highs. This pattern suggests that the downtrend is still intact, even though short-term momentum might be rising.
Understanding these nuances helps traders fine-tune their strategies, distinguishing between moments to expect a reversal and those when the trend is likely to persist.

How to Identify RSI Divergence on a Chart
Spotting divergence requires a careful eye and a solid understanding of price structure. The process begins by plotting the RSI indicator on your chart, usually with the standard 14-period setting. Once that’s in place, the next step is to identify recent highs or lows in the price chart. In an uptrend, look for two consecutive peaks, while in a downtrend, focus on two consecutive troughs.
After pinpointing these price points, compare them with the corresponding RSI values. This comparison helps to reveal any discrepancies between price and momentum. For instance, if the price is making higher highs but the RSI is forming lower highs, it may indicate bearish divergence. Conversely, if the price is making lower lows while the RSI forms higher lows, this could suggest bullish divergence.
However, divergence on its own should not be used as the sole reason to enter a trade. It’s essential to confirm the signal using other tools such as support and resistance levels, volume analysis, candlestick patterns, or additional indicators like MACD or trendlines. This comprehensive approach increases the reliability of your analysis and helps manage risk more effectively.

Pros and Cons of RSI Divergence
Pros:
- Offers early signals of potential reversals
- Works well in both trending and range-bound markets
- Enhances traditional RSI signals
Cons:
- False signals can occur, especially in volatile markets
- Timing can be challenging, price may continue trending for a while even after divergence forms
- Requires confirmation from other tools or indicators
RSI divergence is a valuable tool in a trader’s arsenal, offering insights into shifts in momentum and providing early warning signals of possible trend reversals or continuations. By understanding the different types of divergence, bullish, bearish, regular, and hidden, traders can apply this technique in a wide range of market conditions. However, like any technical indicator, RSI divergence works best when combined with other tools and sound risk management practices.
Whether you’re a day trader seeking quick reversals or a swing trader looking for turning points on larger timeframes, mastering RSI divergence can significantly enhance your analytical skills and trading outcomes.


