 in Trading")
Volatility is an inherent aspect of financial markets, shaping opportunities and risks for traders and investors. To navigate these ever-changing conditions effectively, traders need tools that provide insight into market dynamics. One such indispensable tool is the Average True Range (ATR) indicator.
J. Welles Wilder developed the ATR, a technical analysis tool designed to measure market volatility. Unlike trend-following indicators, which focus on price direction, the ATR gauges the degree of price fluctuations over a given period. This makes it particularly valuable for setting stop losses, determining position sizes, and refining risk management strategies across various asset classes, from stocks and forex to commodities and cryptocurrencies.
In this article, we’ll explore the mechanics of the ATR, its practical applications in trading, and how it can enhance your ability to manage risk and seize opportunities in volatile markets. Whether you’re a seasoned trader or a newcomer, understanding and integrating the ATR into your strategy can be a game-changer.
Understanding the Average True Range (ATR)
The Average True Range (ATR) is a technical analysis tool that measures market volatility. It gives traders insights into how much an asset’s price typically moves over a set period. Unlike trend-following indicators, which predict price direction, the ATR focuses solely on the magnitude of price movements. This makes it vital for traders aiming to manage risk effectively, particularly in volatile markets.
Developed by J. Welles Wilder Jr., the ATR has become a staple in trading strategies across various markets, including forex, equities, commodities, and indices. The indicator adapts seamlessly to different market conditions and timeframes, offering a flexible approach to evaluating price dynamics.
Calculating the ATR
While most trading platforms automatically calculate the ATR, understanding its derivation enhances its interpretability. Here are the steps to compute the ATR:
Step 1: Determine the True Range (TR)
The True Range for a given period is the greatest of the following three values:
- The current high minus the current low
- The absolute value of the current high minus the previous close
- The absolute value of the last close minus the current low
Step 2: Compile TR Values
To calculate the ATR, traders typically use a 14-period sample. The TR values over this timeframe are collected, though the length can vary based on individual preferences or market conditions. Shorter periods (e.g., 2–10) suit intraday traders, while longer periods (e.g., 20–50) are better for swing or position traders.
Step 3: Compute the Average
Calculate the simple average of the TR values for the first ATR value.
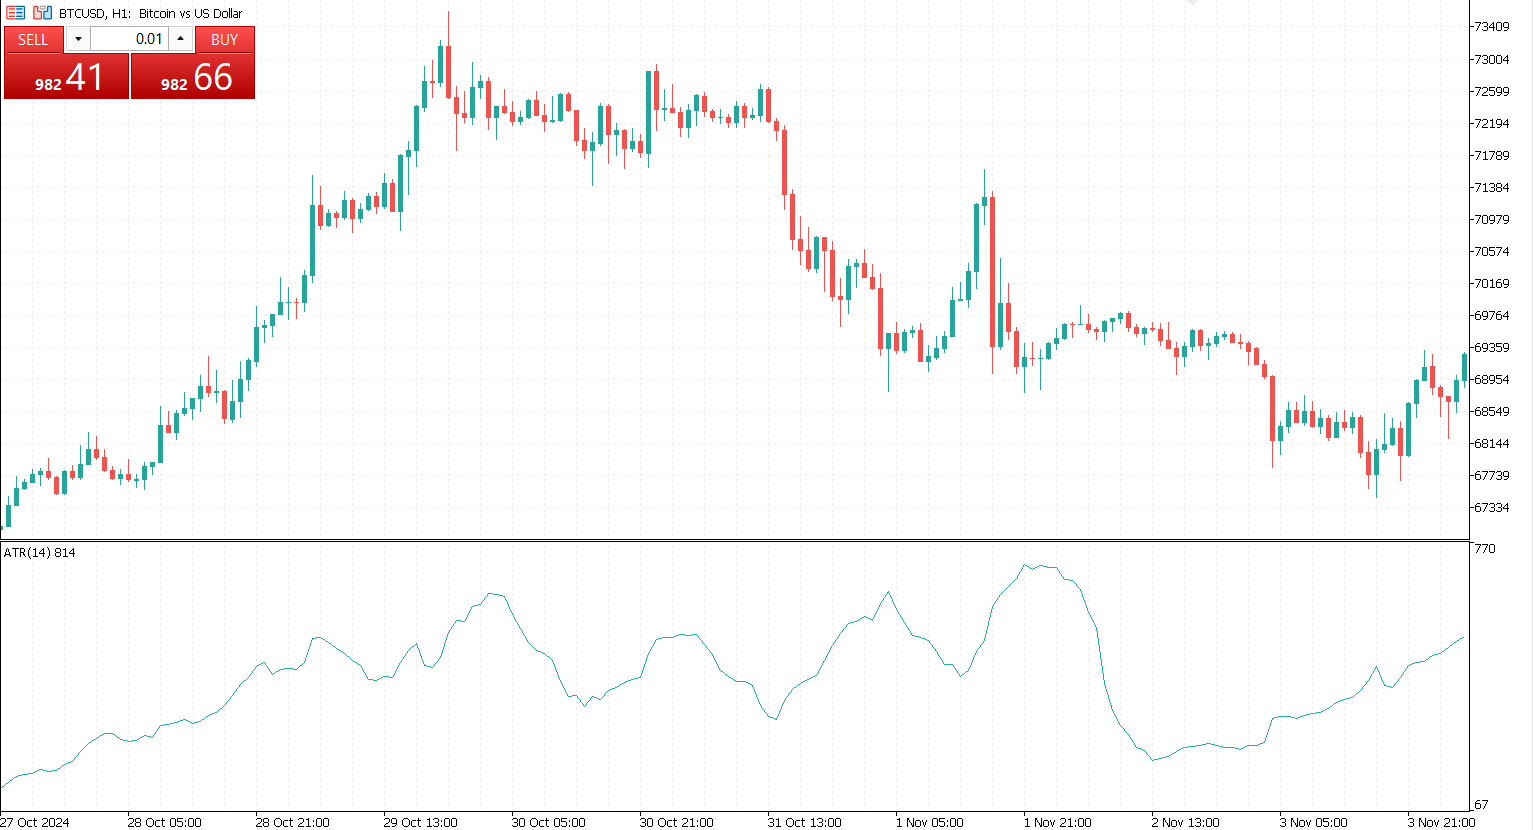
Interpreting the ATR
The ATR provides a single value representing the average range of price movement over the chosen period.
- High ATR Values. Indicate heightened volatility, signaling dramatic price swings. Such conditions suggest potential breakouts or trend reversals.
- Low ATR Values. Reflect lower volatility and stable price movements, often associated with range-bound or consolidating markets.
Traders can use sudden spikes in ATR to signal that market conditions are changing. For instance, an increasing ATR might warn of an impending breakout, while a declining ATR might indicate a consolidating market.
Applications of the ATR in Trading
1. Setting Stop-Loss Orders
The ATR is frequently used to determine stop-loss levels, ensuring they are neither too tight nor too loose. A volatility-adjusted stop-loss allows positions to endure normal price fluctuations while protecting against significant losses.
2. Using Trailing Stops
In volatile markets, the ATR helps traders set dynamic trailing stops. These stops adjust as the market moves, locking in profits while allowing the trade to remain active during favorable trends. If volatility rises, traders may widen the trailing stop, while decreasing volatility may prompt tighter stops.

3. Identifying Breakouts
Spikes in ATR often precede significant price moves. Traders can monitor these spikes to identify potential breakout points and align their entries and exits with expected volatility.
4. Selecting Position Sizes
By gauging volatility through the ATR, traders can adjust position sizes to match market conditions. For instance, a higher ATR suggests a more volatile market, which might prompt smaller position sizes to mitigate risk.
ATR Limitations
While the ATR is a valuable tool, it is not without limitations:
- Lagging Nature. The ATR reflects past price movements and may not predict future volatility precisely.
- No Directional Indication. The ATR only measures volatility and does not provide insight into the trend’s direction.
To overcome these limitations, traders should combine the ATR with other technical tools, such as moving averages, trendlines, or momentum indicators, to form a comprehensive trading strategy.
By mastering the ATR and effectively integrating it into their risk management framework, traders can improve their ability to navigate volatile markets and make more informed decisions.

The Average True Range (ATR) indicator is an invaluable tool for traders seeking to manage risk and navigate the complexities of market volatility. By measuring the degree of price movement rather than its direction, the ATR provides critical insights into an asset’s behavior across various timeframes and market conditions.
From setting stop-loss orders that account for normal price fluctuations to identifying potential breakout points and adjusting position sizes, the ATR offers versatile applications for traders of all experience levels. However, its effectiveness increases when used in conjunction with other technical indicators and analysis methods, enabling a more comprehensive approach to decision-making.


