
Trading success requires skill, strategy, and the right tools. Among the various technical indicators available, the Relative Strength Index (RSI) is a reliable tool for analyzing market momentum and identifying trading opportunities. By incorporating RSI trading strategies into your approach, you can enhance your ability to navigate market conditions effectively, improve profitability, and manage risk.
This guide will explore the RSI, its operation, and traders’ strategies to harness its power in different market scenarios.
What Is the RSI?
The RSI, or Relative Strength Index, is a momentum oscillator developed by J. Welles Wilder Jr., introduced in his seminal 1978 book, New Concepts in Technical Trading Systems. This widely used indicator measures the speed and change of price movements over a specified period, helping traders evaluate the strength of an asset’s price action.
The RSI is plotted as a line graph on a scale from 0 to 100, moving up or down in response to price fluctuations. Its values offer insights into whether a security is potentially overbought or oversold:
- Above 70: Indicates overbought conditions, suggesting a possible price correction or reversal.
- Below 30: Indicates oversold conditions, hinting at a potential price rebound.
Traders also use the RSI to spot bullish or bearish divergences, where price action diverges from RSI movements, signaling potential reversals.
RSI Trading Strategies
Traders utilize RSI (Relative Strength Index) in various strategies to make informed decisions in the markets. Among the most popular approaches are strategies centered on overbought/oversold levels and RSI divergences.
Overbought and Oversold Levels
Overbought and oversold conditions allow traders to anticipate potential trend reversals. The RSI ranges from 0 to 100, with readings above 70 traditionally indicating overbought conditions and readings below 30 signaling oversold conditions. However, these thresholds can vary based on individual trading preferences; some traders use tighter bands, such as 80 for overbought and 20 for oversold, or more moderate ranges like 60 and 40.
An asset is considered overbought when its price has risen too quickly and significantly, making a price correction or reversal more probable. In such scenarios, traders might consider selling the asset or refraining from further purchases. They often seek additional confirmation through bearish candlestick patterns or trendline breaks to enhance decision-making.
Conversely, when an asset is oversold, its price has declined sharply and may be poised for a rebound or reversal. This can present an opportunity to buy the asset or hold off on selling. Bullish candlestick patterns or trendline breaks are frequently used to confirm the bullish signal.
While these conditions can signal potential reversals, relying solely on overbought or oversold levels carries risk, as markets can remain in these states for extended periods without reversing.
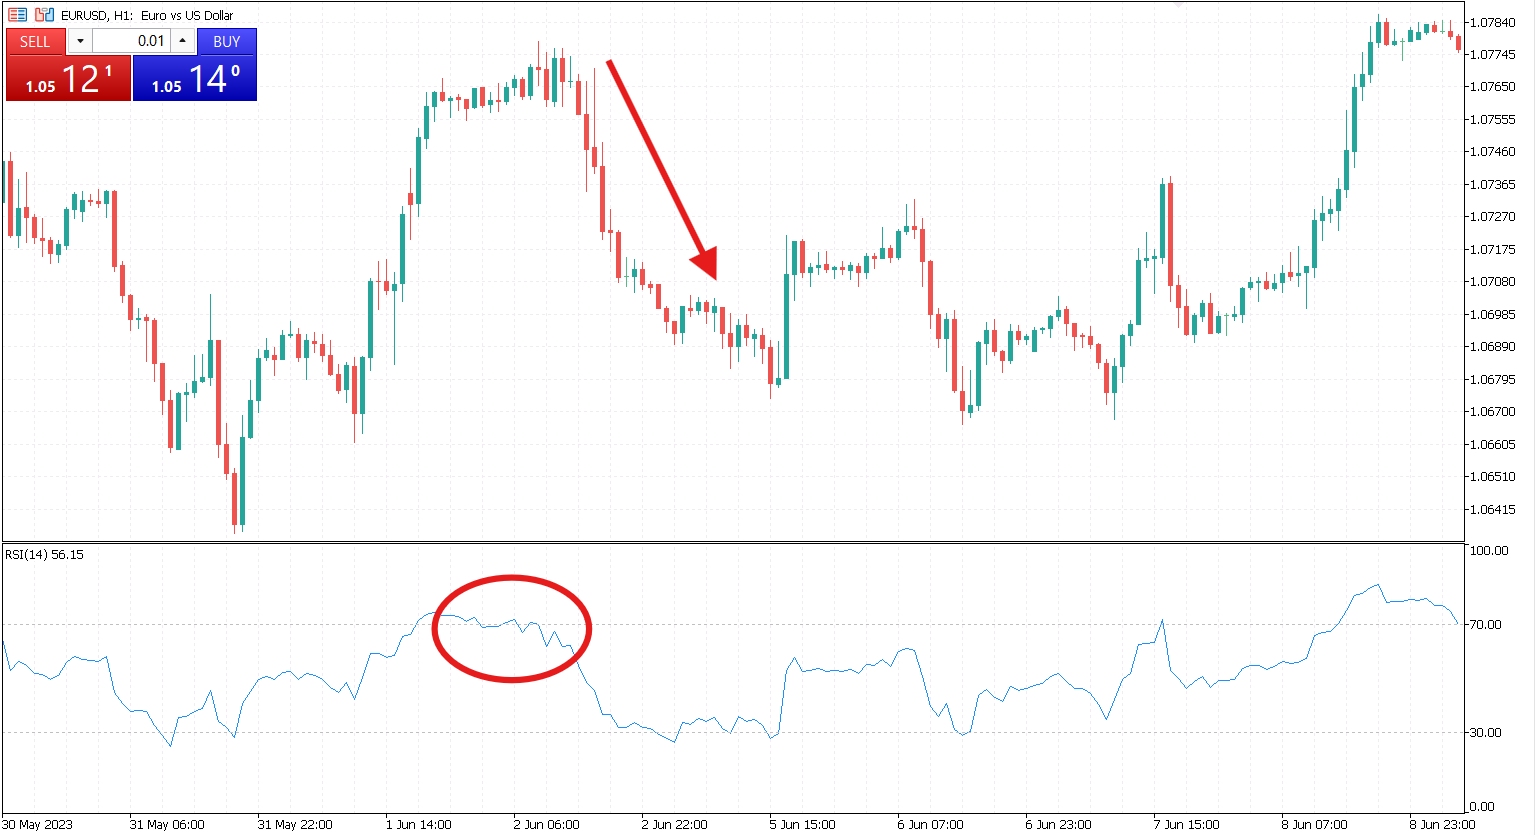
RSI Divergences
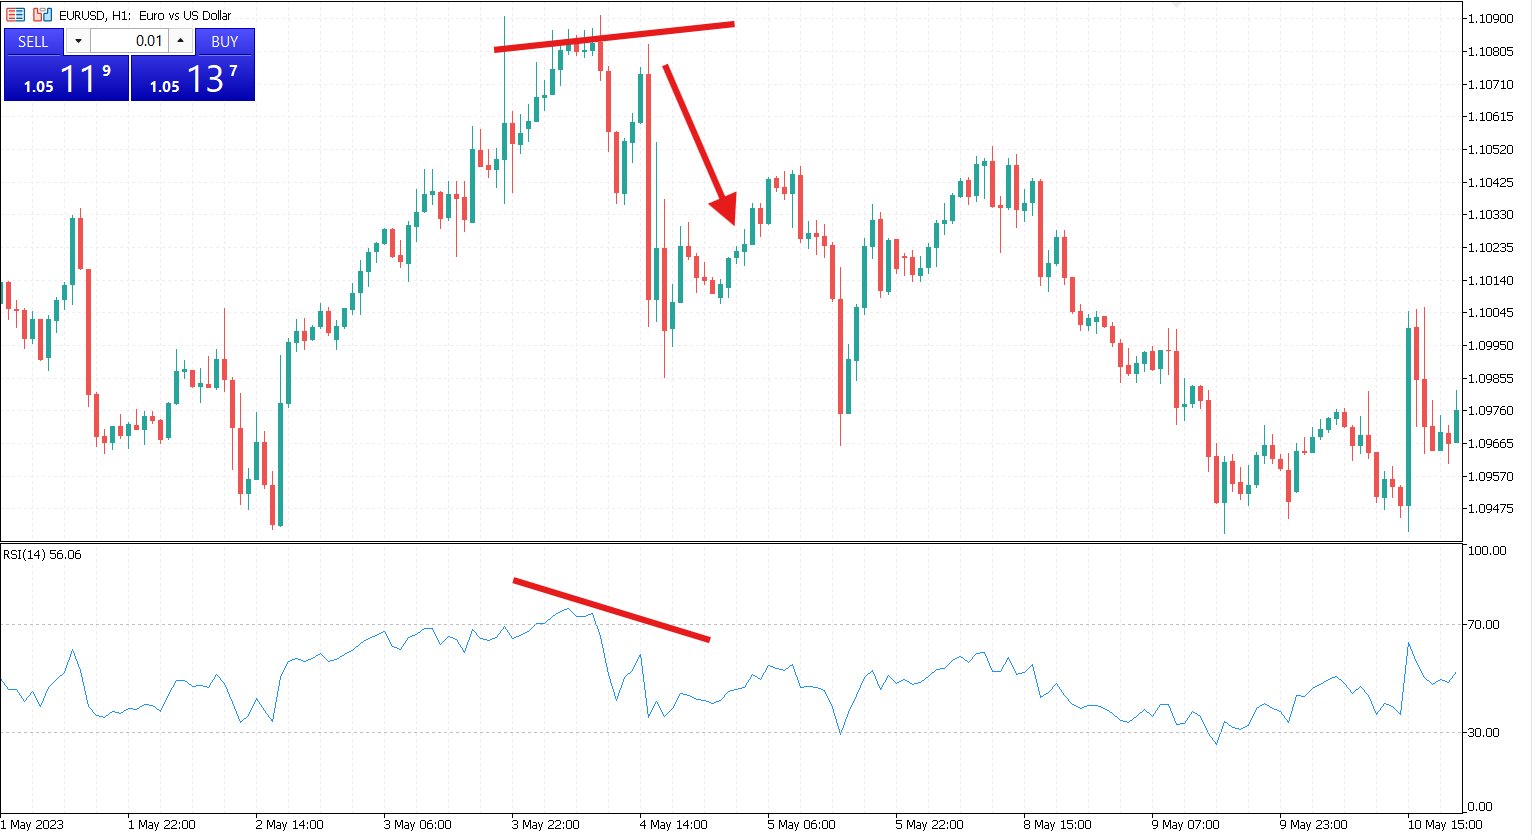
RSI is widely regarded as one of the most effective indicators for identifying divergences, where the price movement of an asset conflicts with the RSI’s direction. This divergence often provides clues about potential reversals or continuations in trends.
A bullish divergence occurs when an asset’s price forms lower lows while the RSI forms higher lows. This indicates that downward momentum is weakening, and an upward reversal may be imminent. Conversely, a bearish divergence happens when the asset’s price makes higher highs, but the RSI registers lower highs, signaling that the upward trend’s momentum is fading.
Hidden divergences also provide valuable insights. A hidden bullish divergence appears when the price forms higher lows, but the RSI shows lower lows, suggesting continued bullish momentum despite a pullback. Similarly, a hidden bearish divergence arises when the price forms lower highs while the RSI forms higher highs, reflecting persistent bearish momentum even during short-term recoveries.
Divergences are more reliable when corroborated by additional analysis, such as chart patterns, volume trends, or fundamental factors. However, traders should approach RSI divergence signals cautiously, as false signals can occur. Confirmation from other indicators or analysis is advisable before executing trades.
RSI trading strategies can help traders anticipate market movements and refine their entry and exit points when used effectively. Combining RSI with other tools and maintaining a disciplined approach to risk management enhances its utility in various market conditions.


