
The Moving Average Convergence Divergence (MACD) indicator is one of the most reliable tools in a trader’s technical analysis arsenal. Known for its ability to capture momentum, trend shifts, and entry/exit opportunities, MACD simplifies market behavior into visual signals. This article focuses exclusively on MACD-based strategies, exploring how traders use this versatile indicator to navigate various market conditions. Whether you’re a beginner or an experienced trader, these strategies can offer a structured approach to making informed decisions.
Core Structure of MACD
The MACD is made up of three components:
- MACD Line – the difference between the 12-period and 26-period exponential moving averages (EMAs).
- Signal Line – a 9-period simple moving average (SMA) of the MACD line.
- Histogram – the difference between the MACD line and the signal line, visualized as bars.
MACD oscillates around a zero line. Crossing above or below this baseline indicates a shift in trend momentum, making it easier for traders to interpret current market strength.
MACD Line Crossover Strategy
One of the simplest and most popular MACD strategies. A bullish signal occurs when the MACD line crosses above the signal line, suggesting increasing buying momentum. A bearish signal appears when the MACD line falls below the signal line, indicating selling pressure.
Traders often wait for the crossover to be confirmed by the closing of a candle or an increase in volume. This approach works well in trending markets and helps avoid false signals during sideways movements.
Zero Line Crossover Strategy
This strategy focuses on the MACD line’s interaction with the zero line. When it crosses above zero, it confirms a shift to bullish territory. When it moves below zero, it indicates growing bearish momentum.
This strategy is ideal for trend confirmation rather than precise entries. Many traders combine it with other indicators or longer-term trend analysis to improve accuracy.
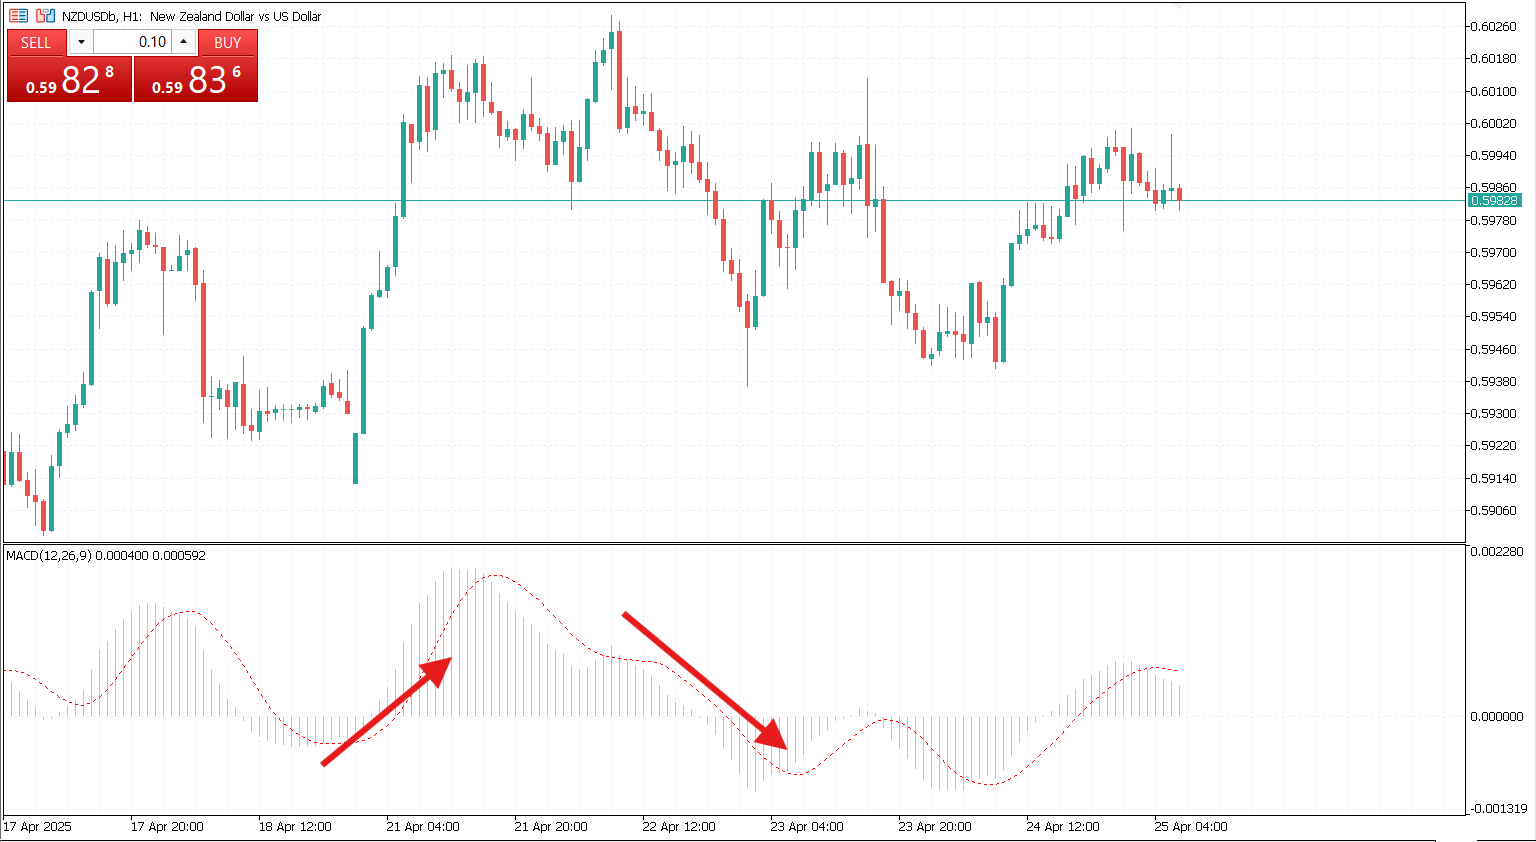
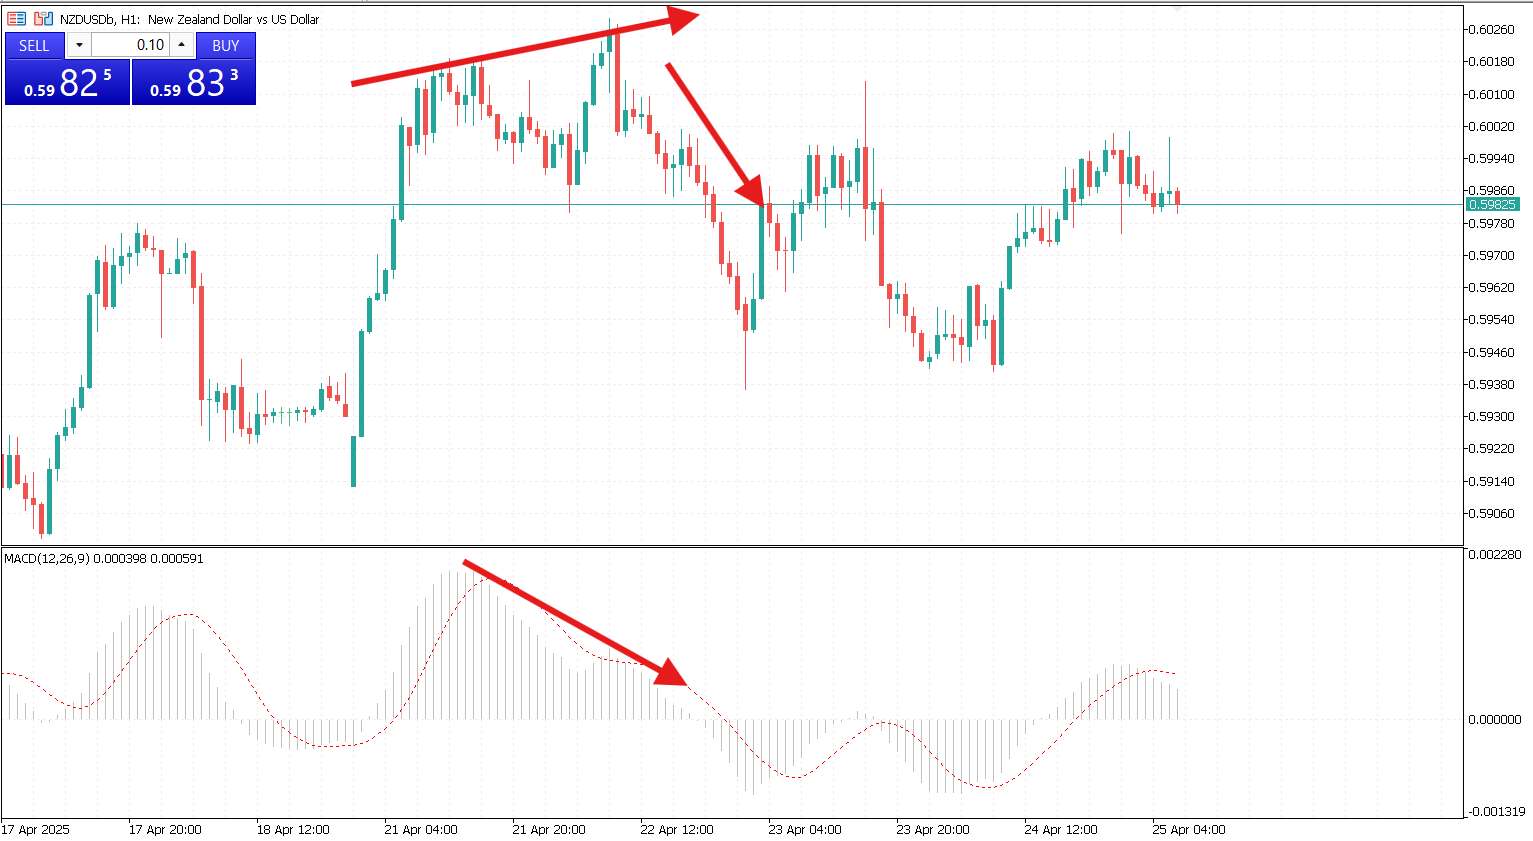
MACD Histogram Reversal Strategy
The MACD histogram visually shows the momentum of price movement. As the histogram bars begin to shrink, it often signals that the current trend is losing strength, even before a crossover takes place.
This strategy is commonly used to exit positions early or prepare for a potential reversal. When applied on higher timeframes, it can provide advance warning for upcoming shifts in market direction.
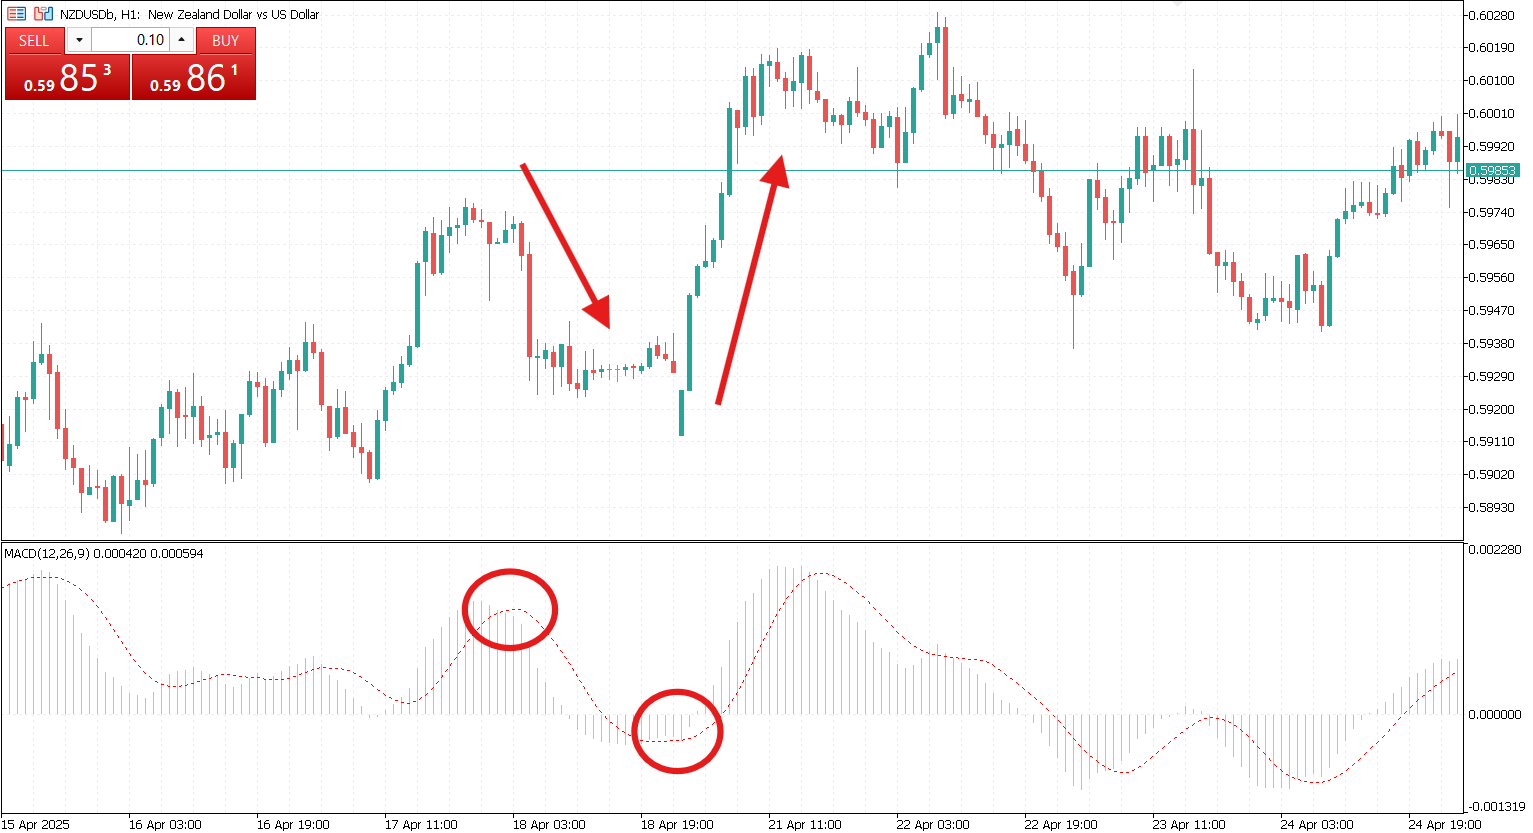
MACD Divergence Strategy
Divergence between price and the MACD line can be a powerful early warning signal. A bullish divergence occurs when price makes a lower low, but the MACD forms a higher low. A bearish divergence happens when price makes a higher high, while the MACD prints a lower high.
This setup is especially valuable at key support and resistance levels. It is often used in combination with price action tools such as trendlines or candlestick patterns for confirmation.
Trend Continuation with MACD
Rather than focusing on reversals, this strategy seeks to identify moments when a trend continues after a pullback. When the MACD line returns to move further in the direction of the main trend after a short correction, it can be a good time to enter or add to a position.
The histogram or MACD line can be used to detect weakening corrections before the trend resumes. This method works well when used alongside higher timeframes and key moving averages.

Tips for Enhancing MACD-Based Strategies
To improve the effectiveness of MACD trading, traders can follow several best practices. These techniques not only reduce false signals but also help in making more informed decisions.
Optimization Tips
- Use higher timeframes for confirmation. Always check the trend on a higher timeframe to ensure your trade aligns with the broader market context.
- Avoid trading in flat markets. MACD gives more accurate signals in trending conditions. Stay out of the market when price action is choppy or indecisive.
- Apply risk management rules. Place stop-loss levels based on market structure. Target a minimum reward-to-risk ratio of 2:1 for each trade.
- Watch the histogram for exit clues. Contracting histogram bars may signal a weakening trend. Use this to exit or tighten your stop-loss.
- Test your strategy before going live. Backtest on historical data and paper trade to understand how the strategy performs under different market conditions.
MACD is a highly adaptable indicator that fits well into multiple trading approaches. Its ability to highlight both trend and momentum changes makes it a favorite among traders across financial markets. From simple crossovers to advanced divergence setups, MACD offers enough flexibility to suit various trading styles.
The key to success lies in understanding each strategy’s context, combining it with smart risk management, and maintaining consistency in execution. Used properly, MACD can provide a clear roadmap in the often unpredictable world of trading.


