
Chart patterns are among the most popular trading tools most professionals use nowadays. They are based on the principle of repetitiveness, one of the main basic technical analysis concepts. Knowing the most frequent ones will allow market participants to enrich their pools of strategies and gain an edge in timing their entries and exits based on the market situation. By reading this article, traders will delve into the basics of chart patterns and learn some of the most frequently used ones.
Double Top
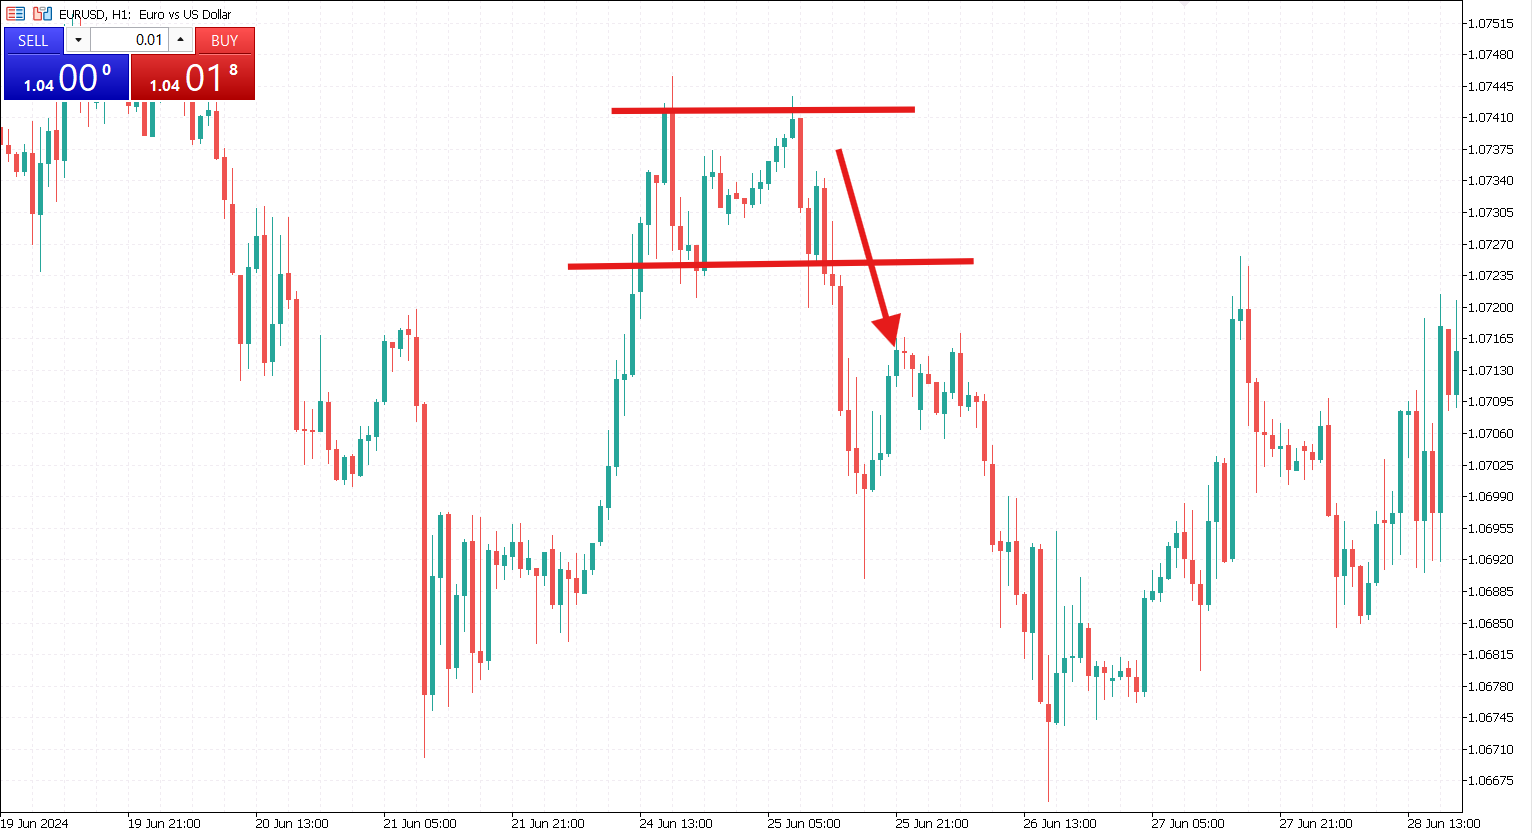
The double top trading pattern is a well-known technical formation that signals a potential reversal in an uptrend. It consists of two consecutive peaks (tops) and a neckline, representing the local low between them. The pattern begins with the price reaching a high and then returning to the neckline, where it finds temporary support.
After this retracement, the price attempts to rise again and retest the resistance level created by the first peak. However, if the price fails to break above the previous high and reverses downward again, the pattern takes shape. The key confirmation of a double top pattern occurs when the price breaks below the neckline, indicating a shift in market sentiment from bullish to bearish.
To effectively trade this pattern, traders must wait for the price to break below the neckline and confirm the breakout decisively. Entering a trade prematurely, before a confirmed breakdown, can lead to false signals and losses.
A stop loss order should be placed slightly above the neckline to protect against potential reversals or failed breakdowns. The exact placement of the stop loss depends on the trader’s risk tolerance. Still, allowing a small buffer above the neckline is generally recommended to account for minor price fluctuations. Confirming the pattern is crucial, as some assets may briefly dip below the neckline before rebounding, creating a bear trap.
Double Bottom
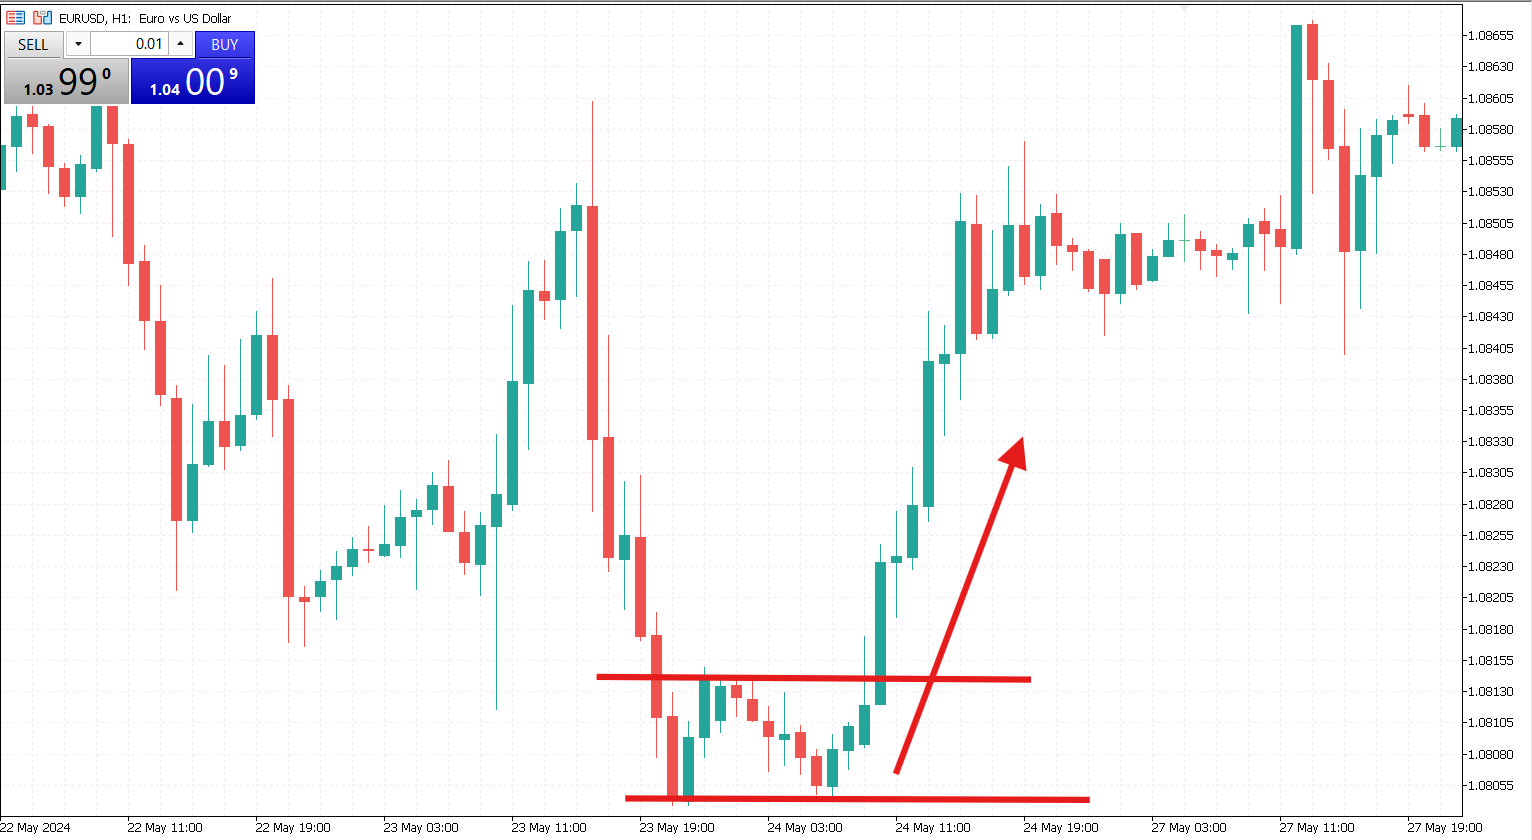
The double bottom pattern is a bullish reversal formation that occurs at a market low, typically around a strong support level. It consists of two consecutive troughs (lows) and a neckline, representing a local high between them. The pattern begins when the price declines to a low, finds support and then rebounds to the neckline.
After this initial bounce, the price retests the support level, forming the second bottom. The pattern takes shape if the price fails to break lower and reverses upward again. A confirmed breakout occurs when the price moves above the neckline, signaling a potential trend reversal from bearish to bullish.
To effectively trade the double bottom pattern, traders must wait for a confirmed breakout above the neckline. Entering a trade too early, before the breakout is confirmed, can lead to false signals and unnecessary losses. A stop loss order should be placed at a reasonable distance below the neckline to protect against potential pullbacks. This buffer helps account for minor price fluctuations that may occur before the upward move gains momentum. Additionally, traders should look for increased trading volume during the breakout, as higher volume often confirms the strength of the price movement and reduces the likelihood of a false breakout.
Bullish Flag
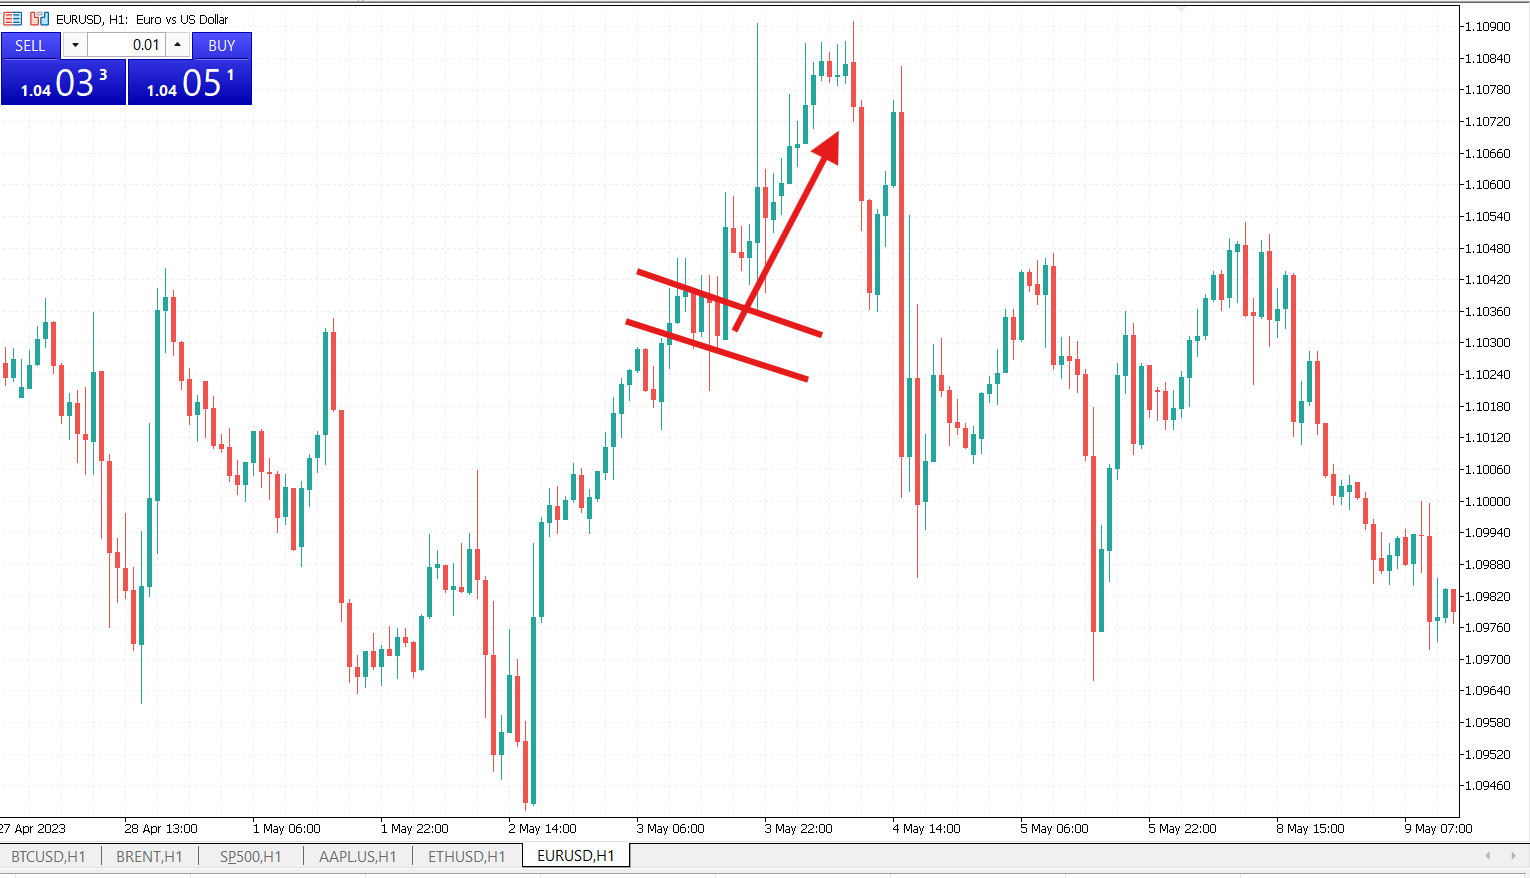
A bullish flag is a trend continuation pattern that allows traders to enter a trade or add to existing positions after a brief consolidation. It begins with an upward price movement, followed by a downward correction. The flag itself is a rectangular formation where this correction occurs.
To place a trade, traders should wait for the price to break above the flag’s upper boundary. Once this breakout occurs, they can buy the asset. Many traders use limit orders in such situations. For instance, they may place a buy stop order above the flag’s upper boundary, which will trigger once the price reaches that level.
Stop loss orders can be set below the flag’s upper boundary to manage risk. To determine a take-profit level, traders often measure the length of the flagpole (the prior leg of the uptrend) and use it as a reference for potential price targets.
Bearish Flag
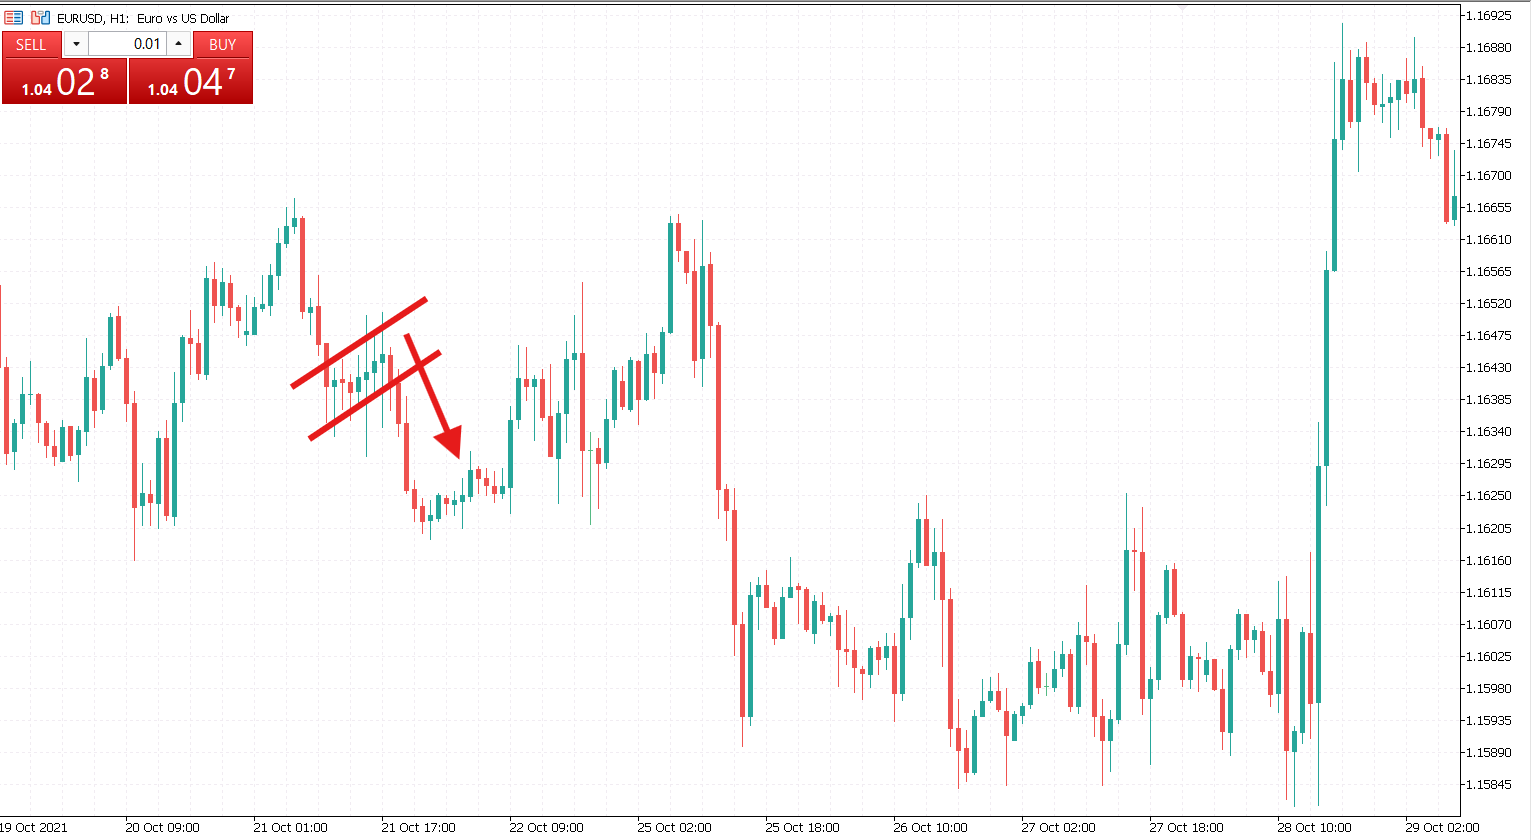
The bearish flag is a trend-continuation pattern that allows traders to enter a short position if they missed the initial move or wish to add to their existing trades. This pattern typically forms after a sharp downward price movement (the flagpole), followed by a consolidation phase where the price moves within a small, upward-sloping channel (the flag).
To trade this pattern effectively, traders should wait for a confirmed breakout below the flag’s lower boundary, which signals the continuation of the downtrend. A strong breakout, ideally accompanied by increased trading volume, confirms the trade setup.
Risk management is crucial when trading the bearish flag. Stop loss orders can be placed just above the upper boundary of the flag to limit potential losses in case of a false breakout. Meanwhile, take profit levels are often set based on the measured move principle, meaning the price target is typically equal to the length of the preceding flagpole projected downward from the breakout point.
Triangles
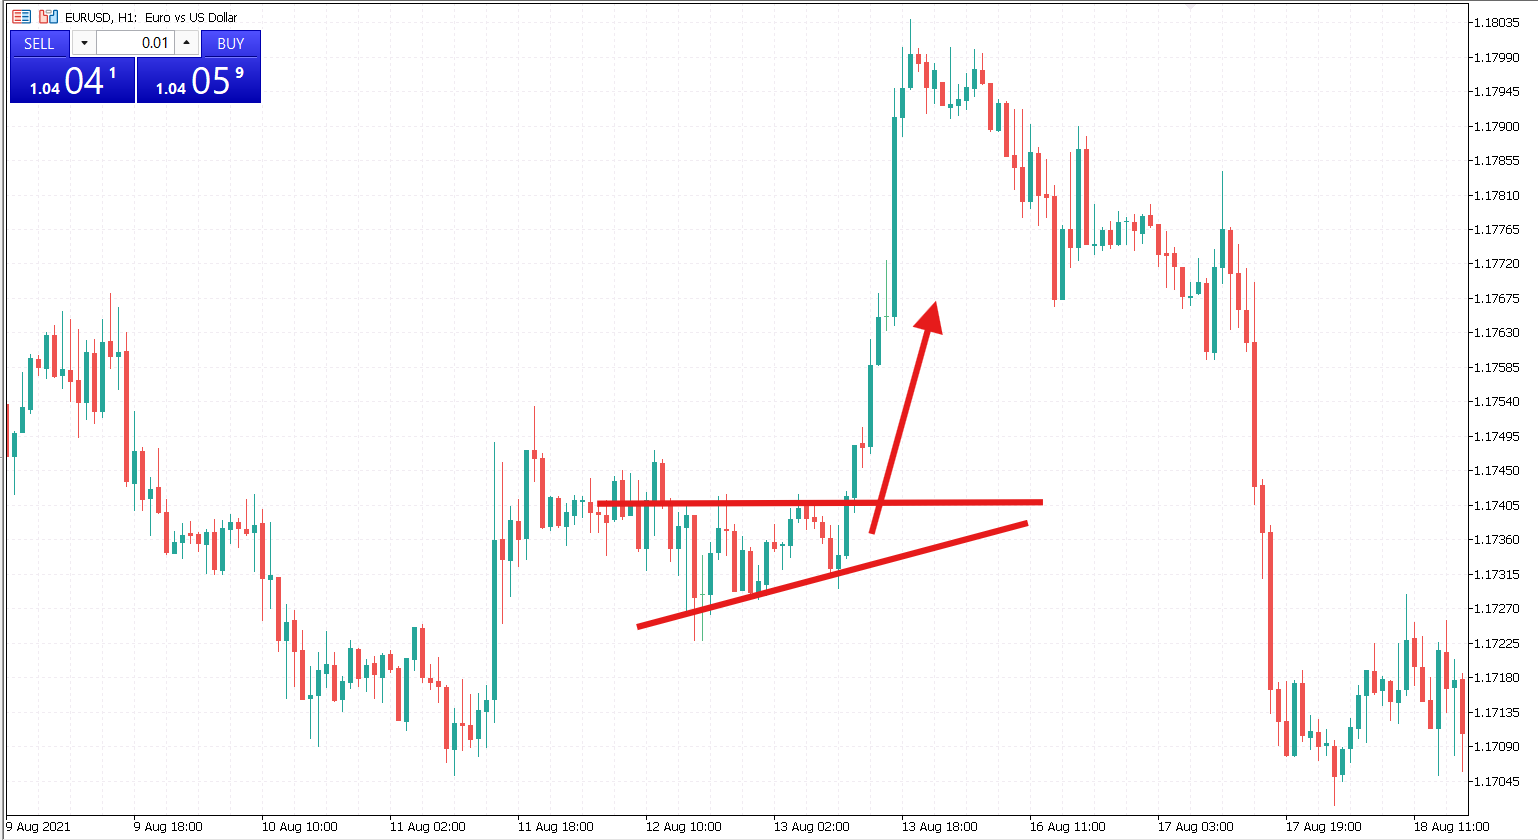
Triangles are among the most common patterns found in charts. These patterns resemble narrowing ranges, where prices fluctuate between two converging lines. The price exits the triangle at a certain point by breaking through one of its edges.
There are three types of triangles:
- Ascending. The lower trendline moves upward.
- Descending. The upper trendline moves downward.
- Symmetrical. The lower trendline moves upward, while the upper trendline moves downward.
To trade triangles, traders should wait for the price to break above or below one of its edges. The direction of the trade depends on the breakout. For instance, traders can sell the asset if the price moves below the lower edge. Conversely, they can buy the asset if the price moves above the upper edge.
Traders often use limit orders to buy or sell, allowing them to enter the market without closely monitoring price fluctuations.
Chart patterns are essential for traders, helping them identify potential market movements and make informed trading decisions. These patterns, such as triangles, flags, and other formations, reflect the psychology of buyers and sellers, offering insights into trend continuation or reversals. By recognizing these patterns, traders can anticipate breakouts, set strategic entry and exit points, and manage risk effectively. However, no pattern guarantees success, so combining technical analysis with other indicators and sound risk management is crucial.
Successful trading with chart patterns requires patience, discipline, and continuous learning. Traders must wait for confirmation before entering a trade and use stop loss and take profit orders to protect their capital. Market conditions and external factors can also influence price movements, so adapting strategies accordingly is essential. By mastering chart patterns and integrating them into a comprehensive trading plan, traders can improve their chances of making profitable decisions in the dynamic financial markets.


