
Bollinger Bands combine price action with volatility, giving traders a dynamic view of the market. Unlike static support and resistance levels, Bollinger Bands adapt to market behavior, expanding and contracting in real-time based on price volatility. This makes them particularly useful in the fast-paced, high-liquidity environment of Forex trading.
This article explores the core structure of Bollinger Bands, how they work, strategies for trading with them, and their advantages and limitations in the context of financial markets.
What Are Bollinger Bands?
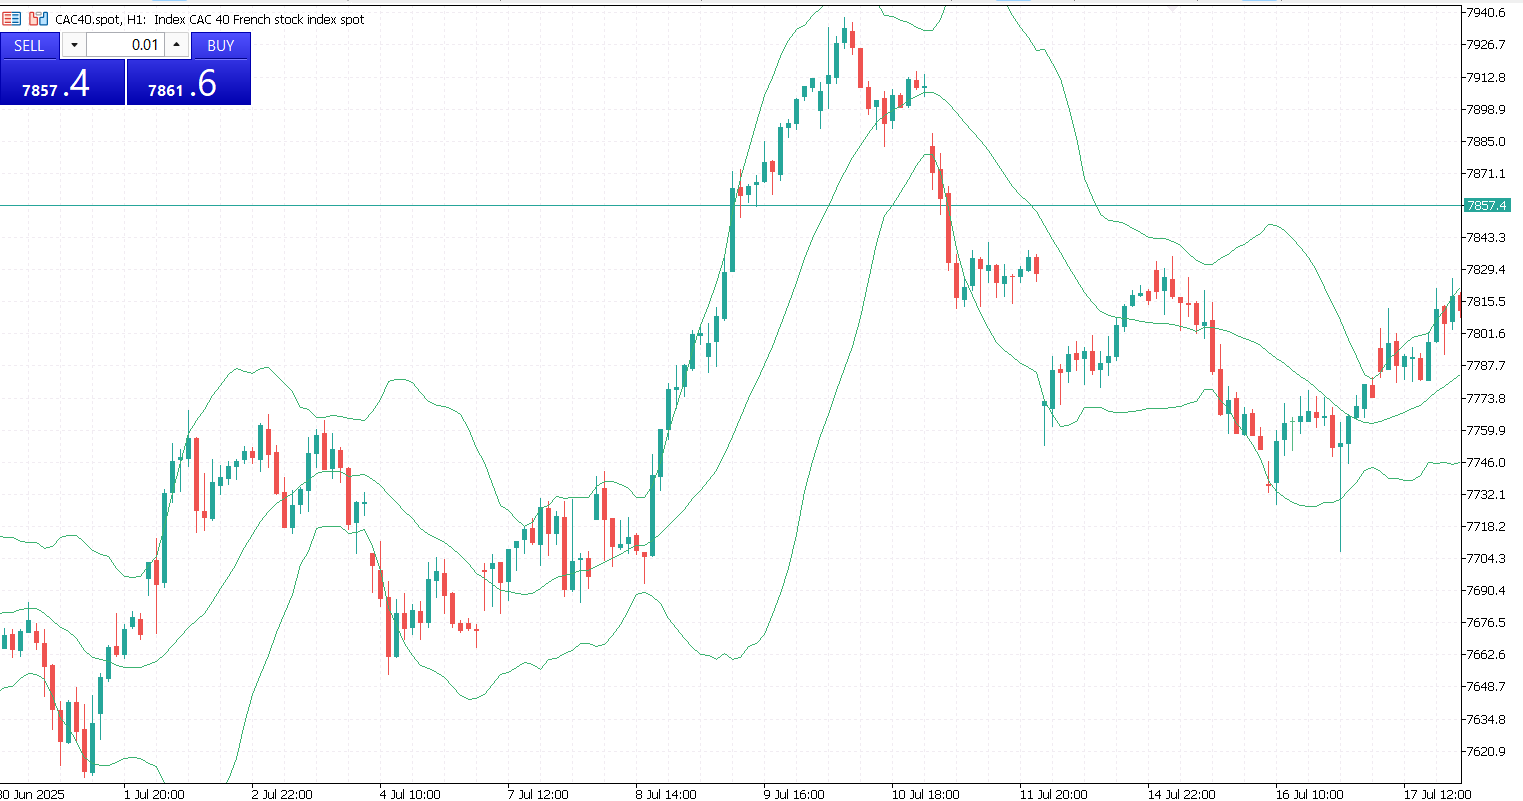
At their core, Bollinger Bands are a set of three lines plotted on a price chart. The middle band is a simple moving average (SMA), typically calculated over a 20-period timeframe. The upper band is derived by adding two standard deviations to the middle band, while the lower band is calculated by subtracting two standard deviations from the middle band.
The concept of standard deviation is crucial in this context. It measures the amount of price variation or volatility. When the market is more volatile, the bands widen. During calm or consolidating periods, the bands contract.
How Bollinger Bands Work in Forex Trading
Bollinger Bands help traders interpret price movements relative to volatility. Here’s how:
- Price touching the bands. When price hits or crosses the upper band, the currency pair may be considered overbought. When price hits or crosses the lower band, it may be considered oversold. This doesn’t mean price will immediately reverse, it signals that current price levels are extended compared to recent norms.
- Band width as a volatility indicator. Wide bands indicate increased market volatility, such as during news releases. Narrow bands suggest low volatility and a possible upcoming breakout.
- The Bollinger bounce. This refers to prices often bouncing back toward the middle band, a concept known as mean reversion. In ranging markets, this strategy can be useful for short-term traders.
- The Bollinger squeeze. When the bands contract significantly, it signals low volatility and often precedes a sharp breakout. Traders anticipate breakouts but must confirm direction with volume or other indicators.

Popular Bollinger Band Strategies in Forex
Bollinger Bands are a versatile technical indicator used by traders to identify potential reversals, breakouts, and trend strength. By combining Bollinger Bands with price action and momentum indicators, traders can develop strategies suited for both ranging and trending markets. Below are some of the most widely used Bollinger Band strategies in forex trading.
Bollinger Band Reversal Strategy (Mean Reversion)
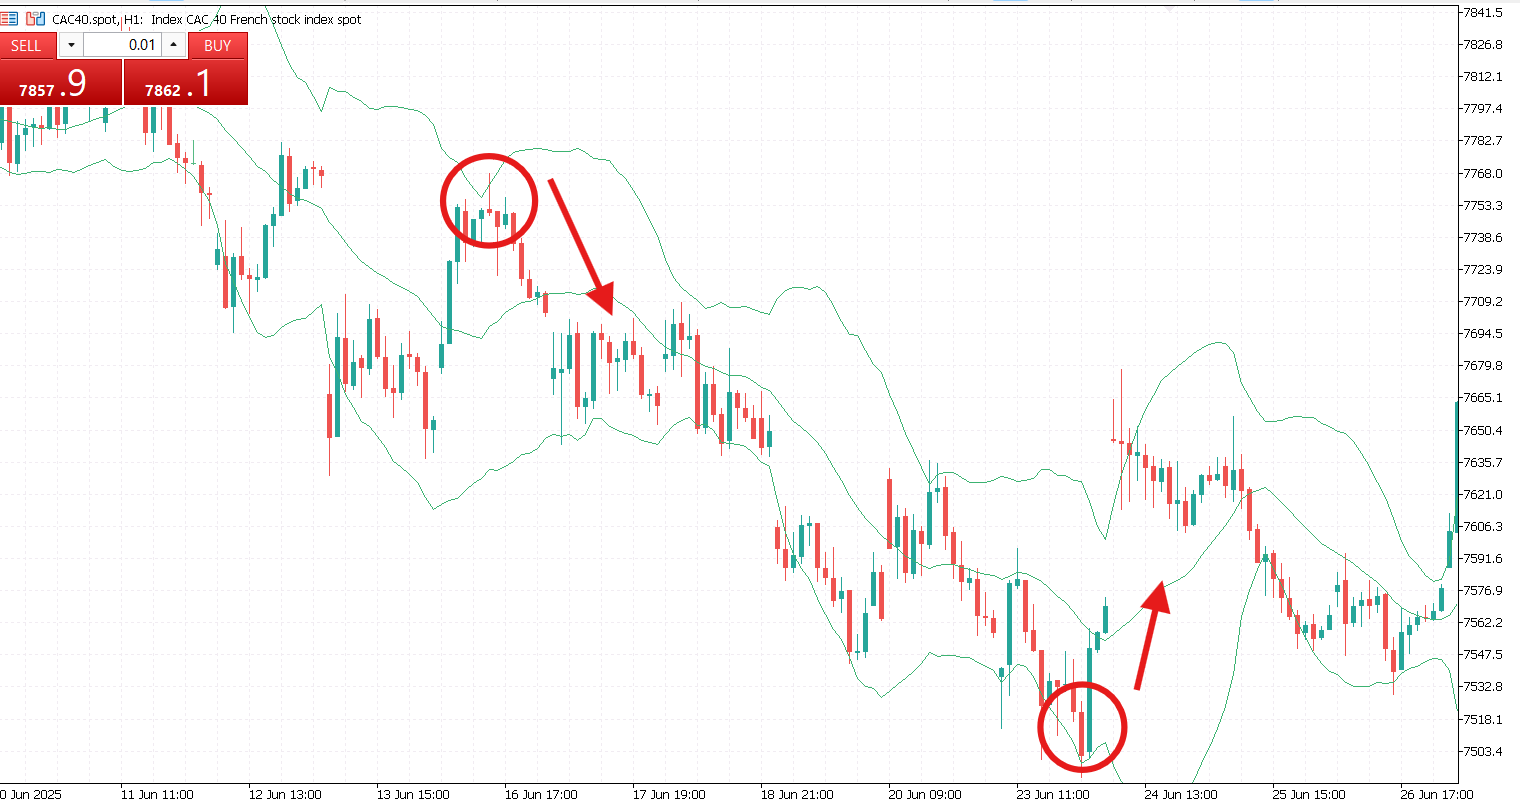
This strategy is based on the idea that prices tend to revert to the mean over time. Traders look to enter a short position when the price touches or crosses above the upper Bollinger Band, and a long position when the price touches or crosses below the lower band. Profit is usually taken near the middle band or after gaining a set number of pips. To improve reliability, confirmation tools such as RSI, MACD, or candlestick patterns can be used. This strategy is most effective in ranging market conditions.
Bollinger Band Breakout Strategy
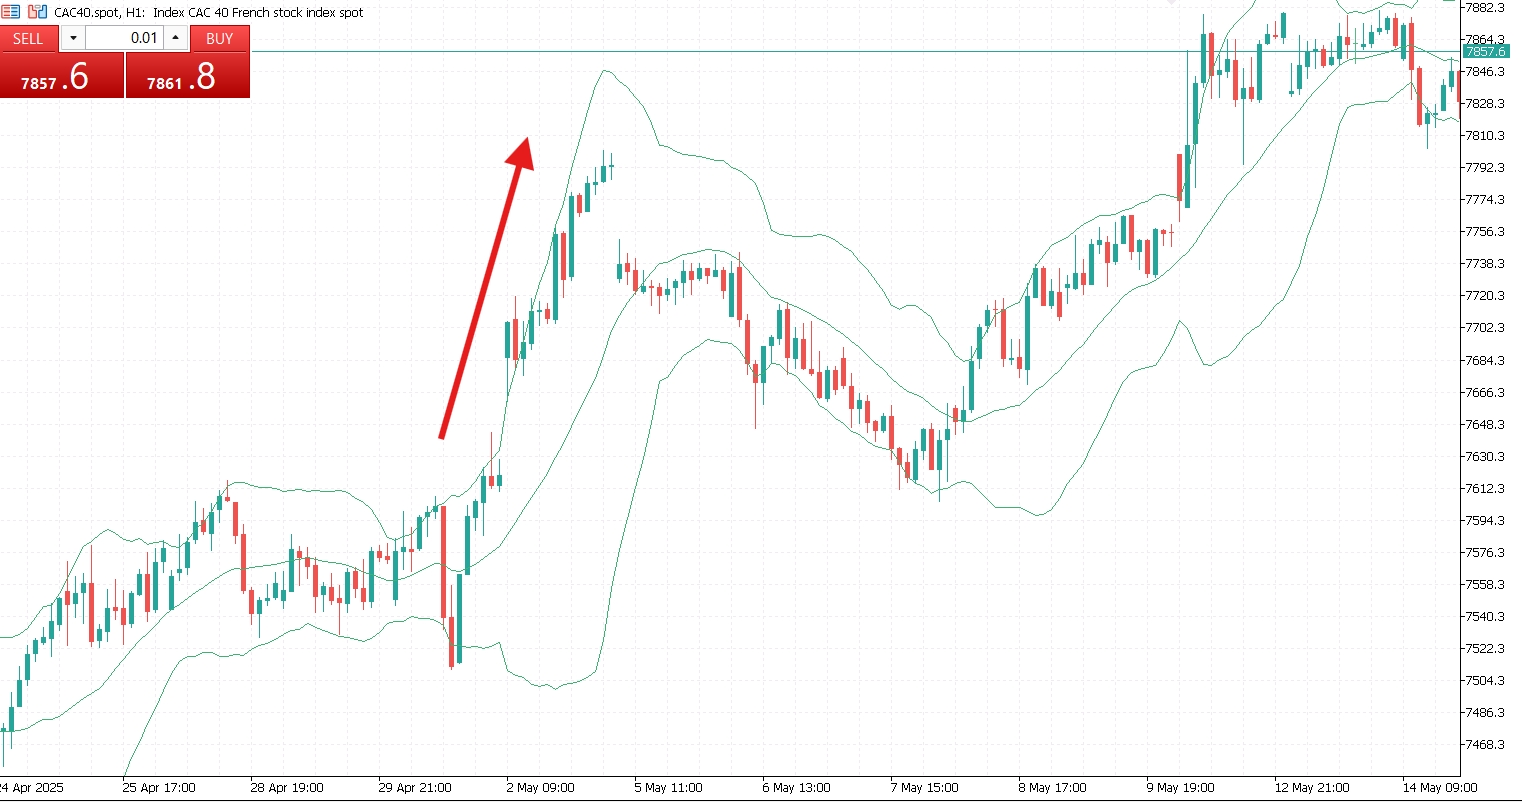
This strategy is designed for trending or high-volatility market conditions. It begins with identifying a Bollinger squeeze, where the bands narrow and signal low volatility. A breakout is anticipated when price moves sharply above the upper band, signaling a buy, or below the lower band, signaling a sell. The move is validated by confirming indicators like increased volume or momentum tools. It is well-suited for trend-following traders or during major news events.
Bollinger Bands with RSI or MACD
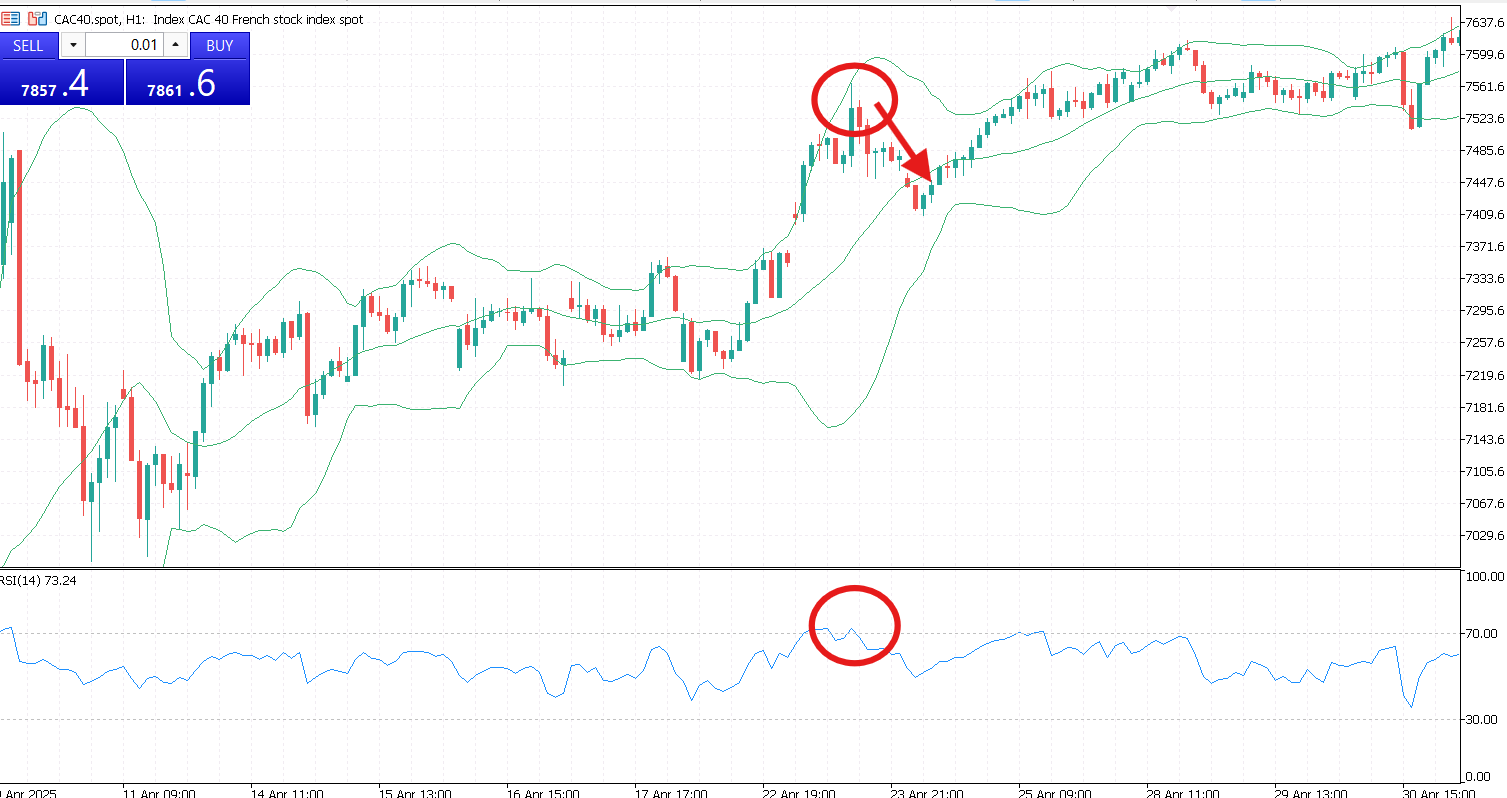
Combining Bollinger Bands with momentum indicators like RSI or MACD can enhance trade confirmation and reduce false signals. RSI is used to identify overbought or oversold conditions when price touches the bands, while MACD helps confirm the direction and strength of a breakout.
Bollinger Bands in Different Market Conditions
- Trending market. In a trending market, Bollinger Bands expand and follow the price direction. During a strong uptrend, the price may ride along the upper band for an extended period, so it’s important not to short too early. In a downtrend, the price often hugs the lower band, signaling sustained bearish momentum.
- Ranging market. In a ranging market, the price moves back and forth between the upper and lower bands. The Bollinger Bounce strategy works well in this environment, as price tends to revert to the mean. Traders should also watch for the bands contracting, which may indicate that a breakout is approaching.

Advantages and Limitations of Using Bollinger Bands
Bollinger Bands are a popular technical analysis tool among traders due to their ability to visually represent volatility and adapt to different market conditions. However, like any indicator, they come with both strengths and weaknesses. Understanding these can help traders use them more effectively as part of a broader trading strategy.
Advantages of Using Bollinger Bands
- Visual representation of volatility makes it easy to spot market conditions at a glance.
- Adaptability allows the bands to adjust dynamically with changing market volatility.
- Versatile in application, suitable for trend trading, reversal setups, and breakout strategies.
- Combines effectively with other indicators like RSI, MACD, and candlestick patterns.
- Helps identify overbought and oversold conditions, particularly useful in mean-reverting markets.
Limitations of Bollinger Bands
- Not a standalone trading system and should be used alongside other indicators or price action analysis.
- Can generate false signals in strong trending markets, where price may remain at extreme levels.
- Based on a moving average, which introduces lag and may cause delayed reactions during sharp price moves.
- Does not predict price direction, as it reflects volatility rather than forecasting movement.
Tips for Trading Forex with Bollinger Bands
Adjust the settings to suit the specific timeframe and currency pair you’re trading. While some traders prefer using 10-period or 50-period simple moving averages, the choice should reflect your trading style and objectives. Always look for price action confirmation, such as pin bars or engulfing candles, rather than relying solely on indicators.
Keep in mind that just because price touches a Bollinger Band or another technical level doesn’t mean a reversal will occur, context and market conditions matter. For greater accuracy, consider combining your strategy with volume or momentum indicators.
Bollinger Bands remain one of the most versatile and widely used indicators in trading. Whether you’re a day trader, swing trader, or scalper, understanding how to read Bollinger Bands can give you deeper insight into market behavior and improve your trading decisions.
They offer a unique view into price volatility and dynamic support/resistance levels. However, like any indicator, they are not infallible. Success with Bollinger Bands comes from integrating them into a broader strategy that includes risk management, confirmation tools, and market context.


