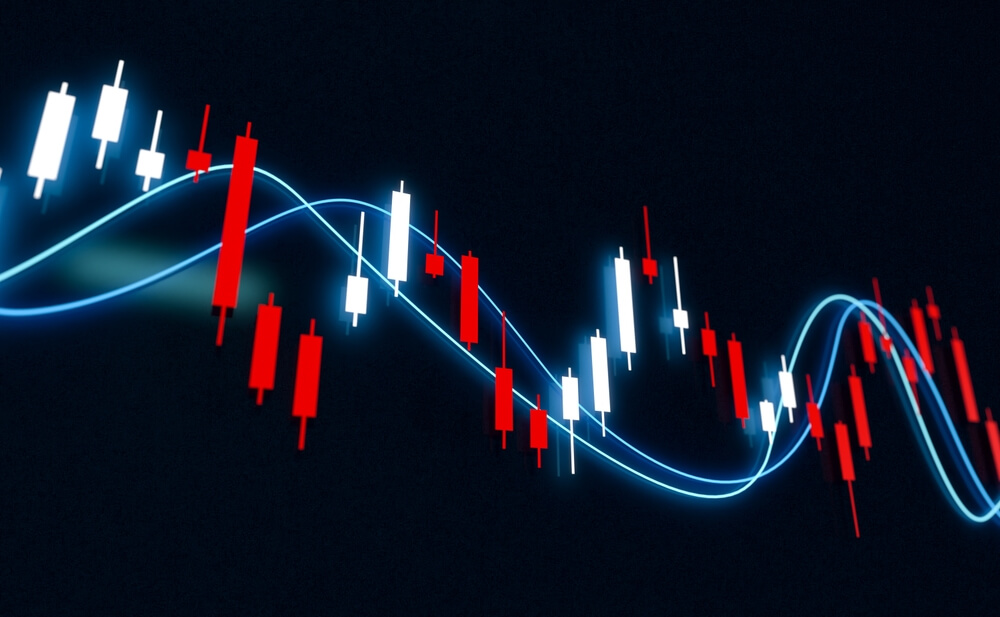
Moving averages (MAs) are among the most versatile and widely used tools in technical analysis. By smoothing out price data, these indicators help traders filter out market noise and identify prevailing trends. Whether you’re a seasoned trader or just starting your journey, understanding how to use moving averages effectively can significantly enhance your trading strategy.
In this guide, we’ll explore the basics of moving averages, how they can signal trends, examine key crossover signals, and discuss strategies for using them effectively while avoiding common pitfalls.
What Are Moving Averages?
A moving average (MA) is a technical indicator that calculates the average closing price of an asset over a specific period.
Two main types of moving averages dominate trading strategies:
- Simple Moving Average (SMA): A straightforward calculation that gives equal weight to all data points in the chosen time frame.
- Exponential Moving Average (EMA): Places more weight on recent prices, making it more responsive to current market conditions.
Moving averages are invaluable tools for traders across markets, whether you’re involved in forex, stocks, or commodities. MAs provide a clear visual representation of trends for new traders, while experienced traders use them to refine their strategies.

How Moving Averages Indicate Trend Direction
The relationship between an asset’s price and its moving averages is a reliable indicator of trend direction:
- Uptrend: When prices trade consistently above a moving average, the market is likely in an uptrend.
- Downtrend: When prices remain below the moving average, it signals a downtrend.
The slope of the MA is equally important:
- An upward-sloping MA suggests bullish momentum.
- A downward-sloping MA points to bearish momentum.
Many traders combine moving averages with other technical indicators, such as momentum oscillators or volume metrics, to confirm trend direction and improve decision-making accuracy.

Key Moving Average Crossover Signals
Crossover signals occur when two moving averages of different periods intersect, providing valuable insights into potential trend changes. The two most common crossover signals are:
The Golden Cross
This bullish signal occurs when a shorter-term moving average (e.g., 50-day) exceeds a longer-term moving average (e.g., 200-day). The golden cross indicates a shift toward upward momentum and often precedes sustained bullish trends.
The Death Cross
The death cross, the bearish counterpart to the golden cross, happens when a shorter-term moving average crosses below a longer-term one. This signal often marks the beginning of a significant downtrend.
While crossover signals are powerful, they are lagging indicators and should be used alongside other tools for confirmation.

Using Multiple Moving Averages Effectively
Incorporating multiple moving averages into your strategy can provide a more nuanced view of market trends. A popular approach involves using three key periods:
- 20-day moving average: Short-term trend indicator.
- 50-day moving average: Medium-term trend indicator.
- 200-day moving average: Long-term trend indicator.
In a strong uptrend, these moving averages will stack in order, with the 20-day MA on top, followed by the 50-day and then the 200-day. The reverse order indicates a strong downtrend.
The spacing between the MAs is also significant:
- Wide separation: Suggests a strong trend with momentum.
- Convergence: This may signal potential trend weakness or a reversal.
This stacking method can be applied to various markets, from equities to forex and commodities, making it a versatile addition to any trading toolbox.

Common Moving Average Trading Mistakes to Avoid
While moving averages are valuable, they are not infallible. Here are common pitfalls to avoid:
Over-Reliance on Moving Averages
Relying solely on MAs for trading decisions can be risky. These indicators are best used in a broader strategy, including fundamental analysis, risk management, and other technical tools.
Using Too Many Moving Averages
Some traders clutter their charts with multiple moving averages, leading to confusion rather than clarity. To keep your analysis focused, stick to two or three key MAs.
Ignoring Lag
MAs are lagging indicators, reflecting past price action rather than predicting future moves. They are more effective for confirming trends than spotting reversals.
Neglecting Risk Management
Even with accurate MA signals, improper position sizing or failure to use stop-loss orders can lead to significant losses. Therefore, risk management should always be prioritized.

Getting Started with Moving Averages
If you’re new to trading with moving averages, follow these steps to integrate them into your strategy:
- Understand the Basics: Learn the differences between SMAs and EMAs and how they behave in various market conditions.
- Choose the Right Timeframes: Align the periods of your moving averages with your trading style. Shorter timeframes suit day traders, while longer ones benefit swing and position traders.
- Combine with Other Indicators: For more robust signals, use MAs alongside tools like RSI, MACD, or Bollinger Bands.
- Test Your Strategy: Practice using averages on a demo account to refine your strategies without risking real money.
Moving averages are indispensable tools in a trader’s arsenal, offering insights into trend direction and momentum while helping to filter market noise. When used effectively, they can enhance decision-making and improve overall trading performance.
However, no single tool guarantees success. Always combine moving averages with a comprehensive trading strategy, proper risk management, and a commitment to continuous learning.


