
Double top and double bottom patterns are essential tools in technical analysis, helping traders spot potential market reversals and take advantage of shifting trends. These patterns signal key turning points when trends lose momentum, offering valuable insights into when the market might change direction. Recognizing and integrating these formations into a trading strategy can significantly improve trading performance. This article explores how these patterns work, their characteristics, risks, and how traders can profit from them.
Double Top and Double Bottom Basics
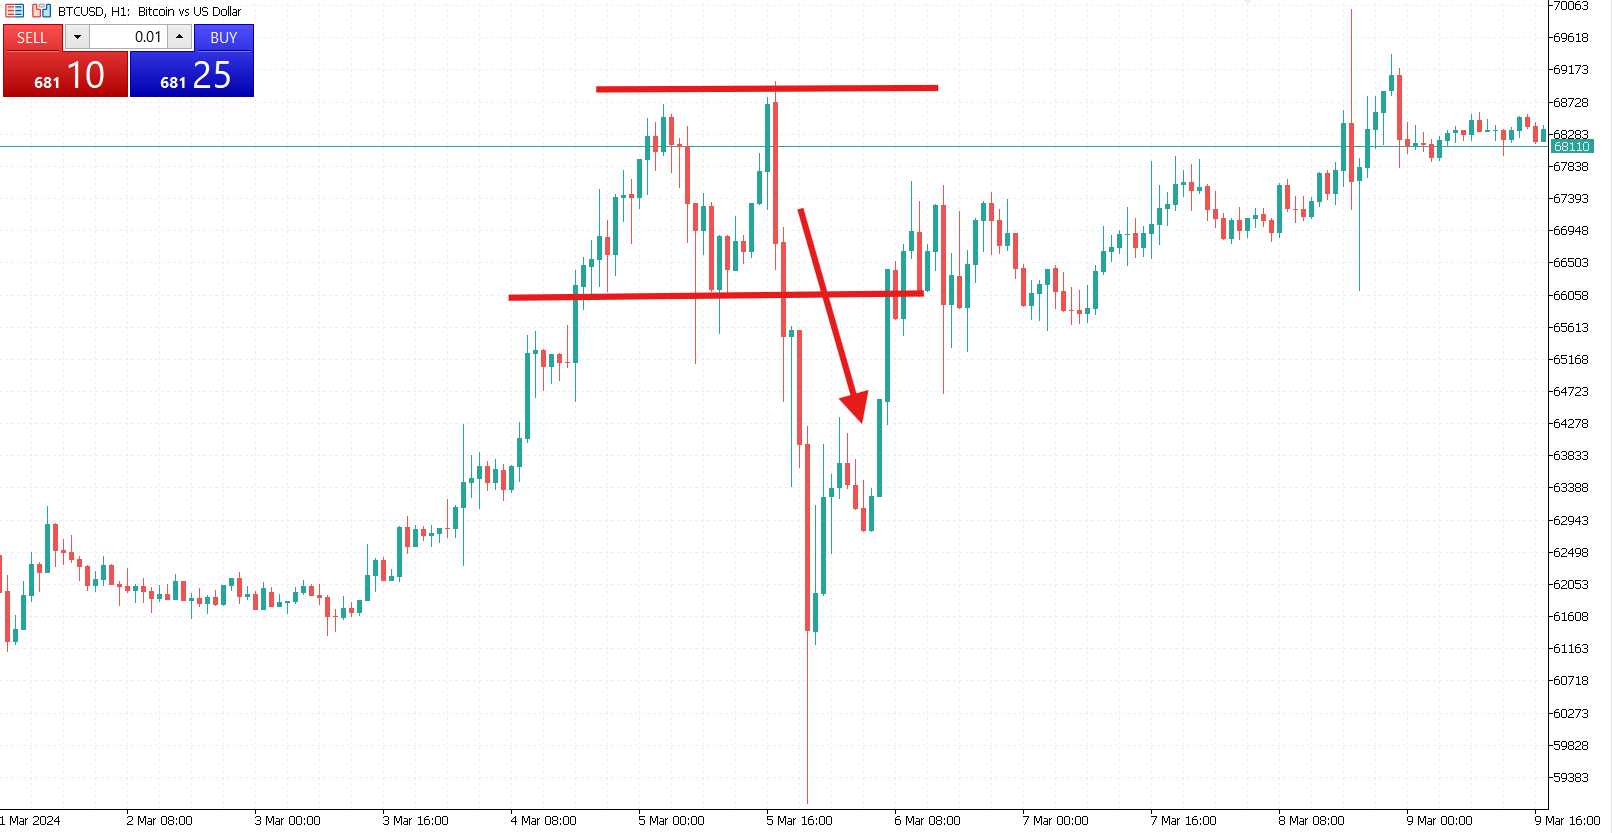
A double top is a bearish reversal pattern indicating an uptrend may end. It forms when the price rises to a peak, retreats, and then makes another attempt to climb but fails to surpass the first high. This creates two distinct peaks at similar levels. The inability to continue upward shows that buying pressure is diminishing, potentially paving sellers’ way to lower prices.
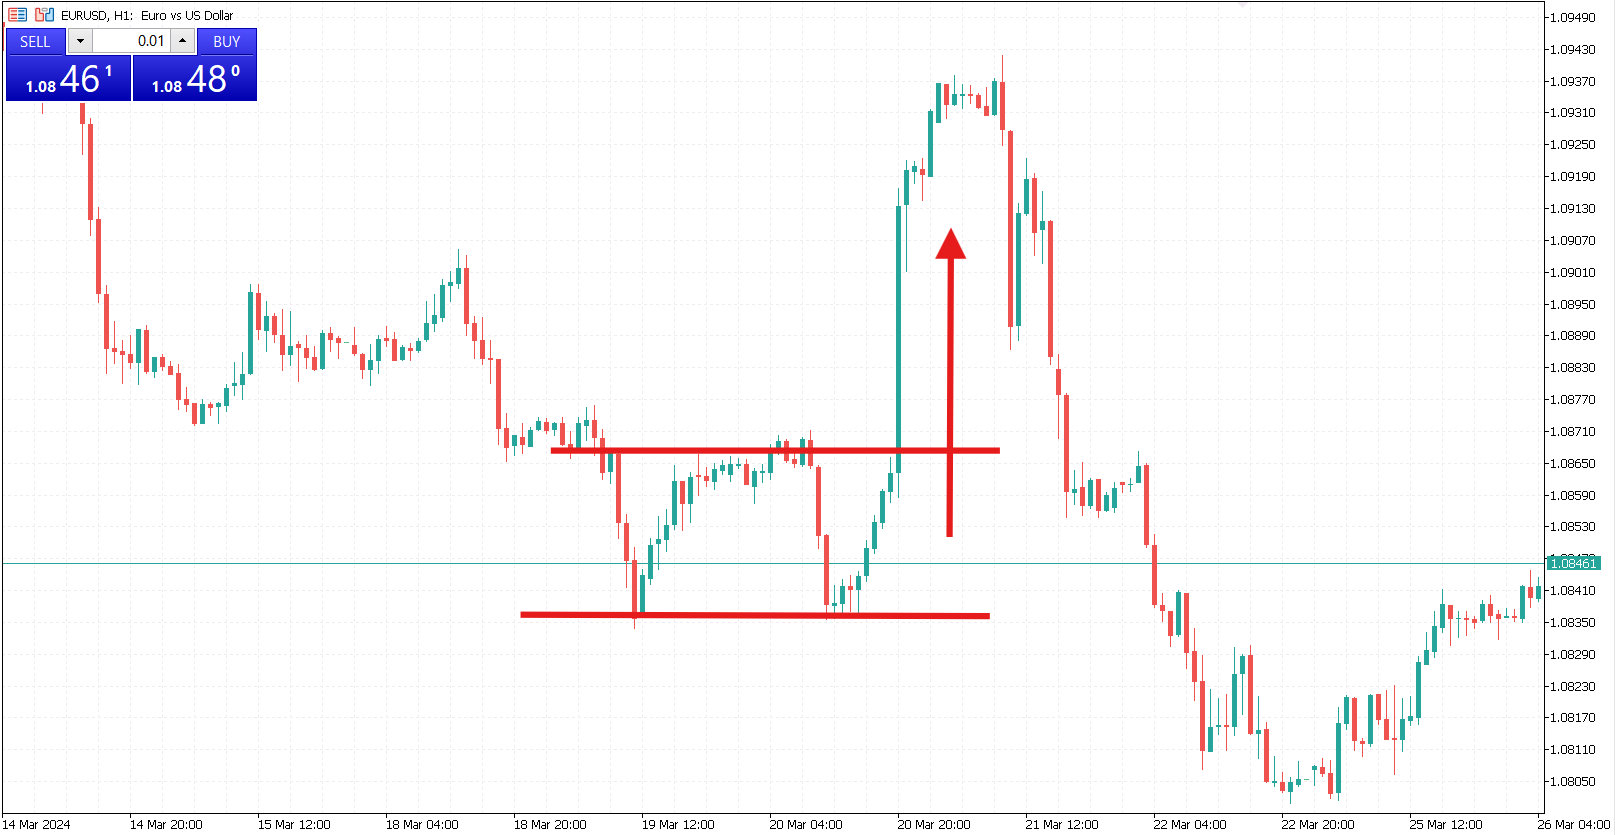
On the other hand, a double bottom signals a bullish reversal at the end of a downtrend. In this formation, the price drops to a low, bounces upward and then dips again to roughly the same level before rallying. These two lows create a “W” shape on the chart, indicating that the selling momentum has faded and buyers may push prices higher.
Both patterns offer crucial insights into market psychology. They reveal moments when traders struggle to maintain the existing trend, providing opportunities to enter positions at a favorable time.
Characteristics of Double Top and Double Bottom Patterns
Identifying double tops and double bottoms involves recognizing a few essential features. Both patterns have two distinct peaks or lows at similar price levels, with a moderate pullback in between. Between these highs or lows lies a key level known as the neckline. This line serves as support in the case of a double bottom or resistance for a double top. A confirmed breakout occurs when the price moves beyond the neckline, signaling the potential start of a new trend.
Volume often plays a critical role in validating these patterns. A breakout accompanied by strong trading volume suggests that the market supports the new trend direction, increasing the probability of a successful trade. Conversely, a breakout with low volume might signal a false move, requiring traders to be cautious.

How to Trade Double Top and Double Bottom Patterns
Trading these patterns effectively requires patience and careful observation. For a double top, traders generally wait for the price to break below the neckline before entering a short position, anticipating further downside. A stop-loss order can be placed above the second peak to manage risk. Profit targets are typically set by measuring the distance between the peaks and the neckline and projecting it downward from the breakout point.
With a double bottom, the strategy involves waiting for the price to break above the neckline, indicating that buyers have gained control. Once the breakout is confirmed, entering a long position becomes favorable. Placing a stop-loss order below the second low helps manage potential losses. Like the double top, profit targets are determined by projecting the pattern’s height upward from the breakout point.
Successful traders know that entering too early, before a breakout is confirmed, can lead to losses. Waiting for a retest of the neckline or confirmation through other indicators like the Relative Strength Index (RSI) reduces the risk of false breakouts.

Key Considerations for Trading Success
Several factors determine how effective these patterns will be in generating profitable trades. Higher time frames, such as daily or weekly charts, often yield more reliable signals because they reduce the impact of short-term volatility. Combining pattern analysis with other indicators, like RSI or Moving Average Convergence Divergence (MACD), strengthens the validity of trade signals and helps filter out noise.
Volume analysis is also essential. A breakout accompanied by high volume shows that the market supports the new trend, increasing the trade’s success probability. Conversely, low volume during a breakout might signal indecision, making it riskier to enter a position.
Market conditions also play a significant role. For instance, a double top pattern may perform better if the broader market shows signs of slowing down. In contrast, double bottoms can work effectively when sentiment shifts from bearish to bullish. Traders must stay updated on economic events and market trends to align their strategies with prevailing conditions.

Managing Risks
Trading double tops and double bottoms carries risks, including the possibility of false breakouts. Even well-formed patterns can fail, leading to unexpected reversals. One way to mitigate this risk is by using stop-loss orders to protect against significant losses. Traders can also wait for a neckline retest after the breakout, confirming that the new trend will likely continue.
Consistency and discipline are vital when trading these patterns. Not every setup will result in a successful trade, so sticking to a strategy and avoiding emotional decisions is essential. Traders can also diversify their portfolios by applying these patterns across different assets, reducing exposure to individual market risks.
Double top and double bottom patterns offer valuable insights into market reversals, giving traders opportunities to profit from changing trends. Recognizing these patterns and knowing when to act allows traders to enter positions confidently and manage risks effectively. However, success with these patterns requires more than just identifying the formations. Patience, discipline, and supporting indicators are critical components of a well-rounded strategy.


