
Developed in Japan centuries ago, candlestick charts provide a visual representation of price action, including the open, high, low, and close of a trading period. Among the myriad patterns traders observe, the tweezer tops and tweezer bottoms stand out for their simplicity and reliability. These formations, often occurring at key support and resistance levels, can signal potential trend reversals and provide valuable entry and exit points for traders across various markets, including stocks, forex, and cryptocurrencies.
This article delves into the characteristics, formation, and significance of tweezer tops and bottoms, offering insights into how traders can recognize and apply these patterns effectively in their strategies.

Understanding Candlestick Basics
Before diving into tweezer patterns, it’s crucial to understand the fundamentals of candlestick charts. Each candlestick represents a specific time frame, ranging from minutes to months, and consists of a body and wicks (or shadows). The body represents the range between the opening and closing prices, while the wicks indicate the highest and lowest prices within that period. Candlestick patterns emerge when certain sequences of candlesticks appear, revealing market psychology and the battle between buyers (bulls) and sellers (bears).
Tweezer patterns are particularly useful because they are visual, intuitive, and often appear at pivotal points in the market, offering clues about potential reversals.
Tweezer Tops: Definition and Significance
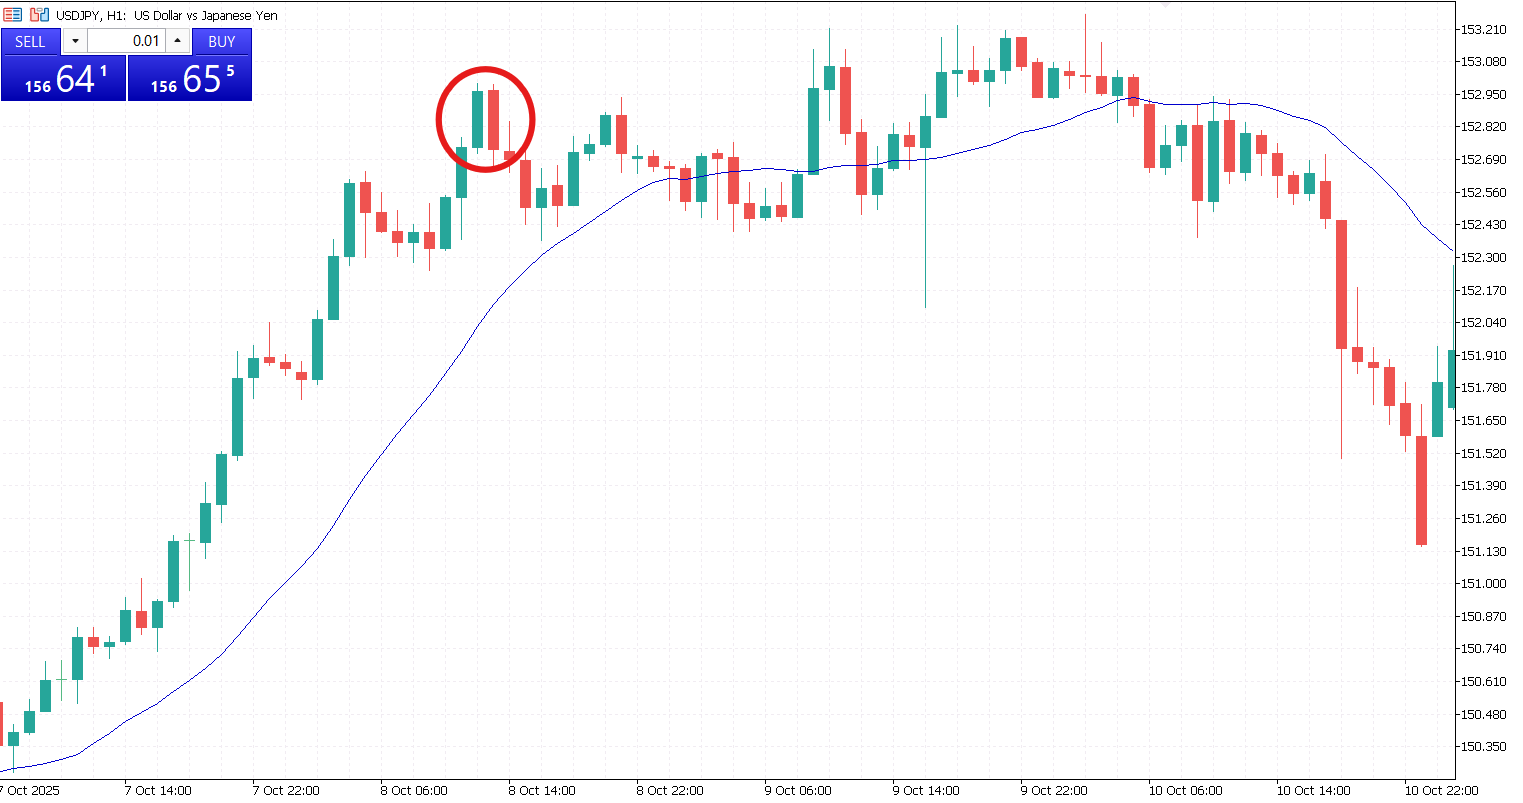
A tweezer top is a bearish reversal pattern that usually appears at the peak of an uptrend. It consists of two consecutive candlesticks with nearly identical highs, indicating that buyers are struggling to push prices higher and sellers are beginning to gain control. The pattern signals potential weakness in the bullish trend and a possible reversal toward a downtrend.
Key characteristics of tweezer tops:
- Occurrence at the peak. Typically forms after a significant upward price movement.
- Two candles with similar highs. The highs of the two candles are almost the same, showing resistance at a specific level.
- First candle bullish, second candle bearish. The first candle reflects the continuation of the uptrend, while the second candle shows hesitation or rejection from sellers.
- Confirmation needed. Traders often wait for the following bearish candle to confirm the reversal.
Trading the Tweezer Top
When spotting a tweezer top, traders may look for short-selling opportunities or consider taking profits on long positions. However, confirmation is crucial; without it, the pattern may fail, and the uptrend could continue. Combining the pattern with other technical indicators, such as RSI (Relative Strength Index) or MACD (Moving Average Convergence Divergence), can improve the reliability of signals.
Tweezer Bottoms: Definition and Significance
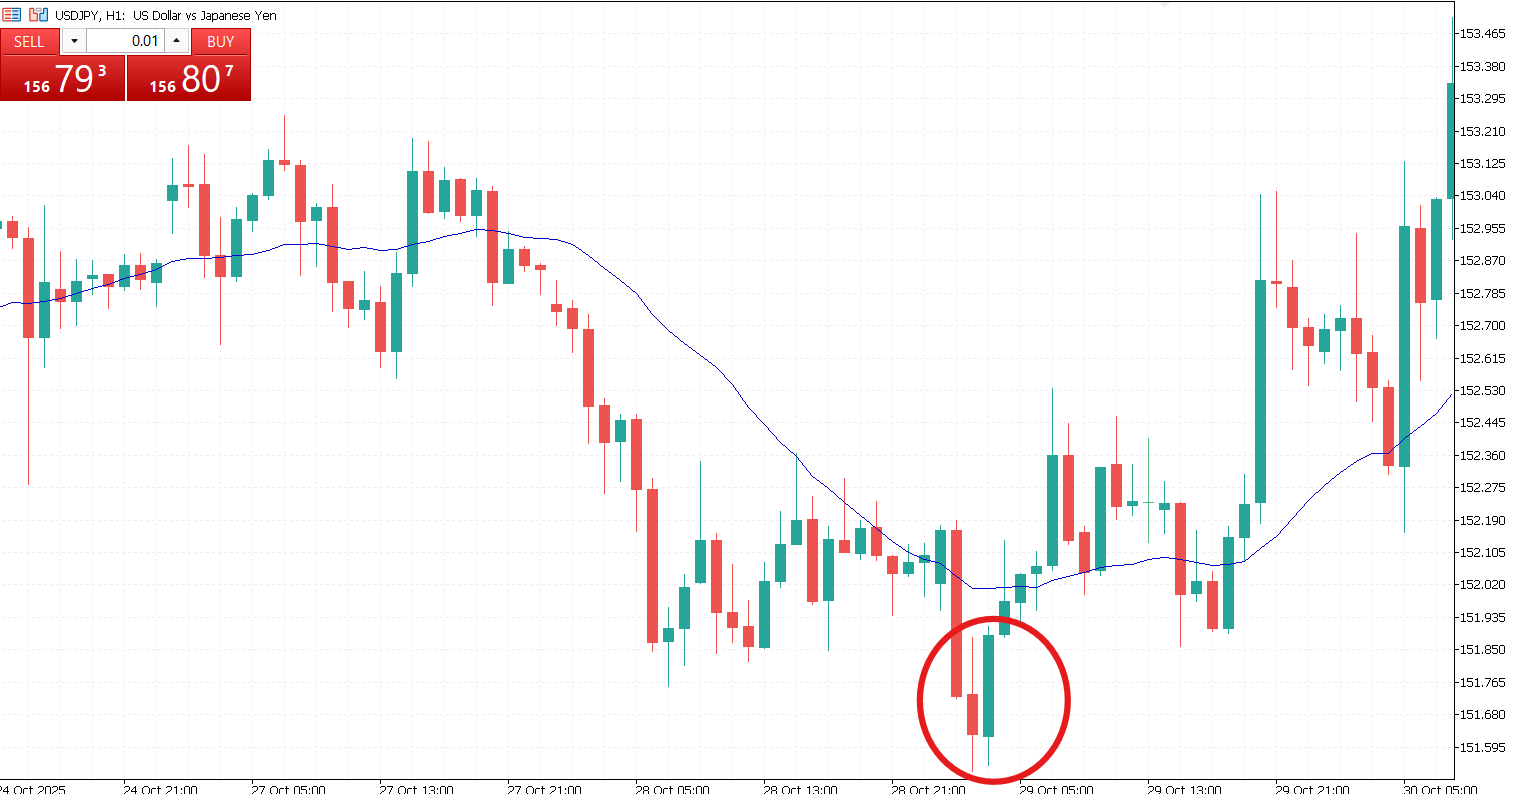
Conversely, a tweezer bottom is a bullish reversal pattern that generally appears at the bottom of a downtrend. It consists of two candlesticks with nearly identical lows, indicating that sellers are losing momentum and buyers are starting to push prices upward. This pattern suggests a potential shift from bearish to bullish sentiment and often marks an ideal entry point for traders looking to capitalize on an upward reversal.
Key characteristics of tweezer bottoms:
- Occurrence at the trough. Typically appears after a significant downward price movement.
- Two candles with similar lows. The lows of both candles are almost identical, demonstrating support at a specific price level.
- First candle bearish, second candle bullish. The first candle continues the downtrend, while the second shows buyer intervention.
- Confirmation needed. Traders usually wait for a subsequent bullish candle to confirm the reversal.
Trading the Tweezer Bottom
A tweezer bottom provides an opportunity to enter a long position or close short trades. As with the tweezer top, confirmation is key. Traders may combine this pattern with trend indicators or volume analysis to gauge the strength of the potential reversal.

Psychology Behind Tweezer Patterns
Tweezer patterns reflect the psychology of market participants. In a tweezer top, buyers attempt to push prices higher but meet resistance, as sellers step in to take profits. This tug-of-war manifests as two candles with identical highs, signaling the market’s indecision and potential trend reversal.
In a tweezer bottom, sellers continue pushing prices lower but encounter strong buying interest, resulting in two candles with matching lows. This pattern highlights the transition of control from sellers to buyers and often signals a shift in sentiment.
Understanding this psychological aspect helps traders interpret market dynamics rather than relying solely on visual patterns.
Tweezer tops and bottoms are visually intuitive candlestick patterns that offer valuable insights into potential trend reversals. By recognizing the formation of these patterns, understanding the market psychology behind them, and confirming with additional indicators, traders can identify strategic entry and exit points.
While no pattern guarantees success, incorporating tweezers into a broader technical analysis toolkit enhances a trader’s ability to interpret market sentiment and make informed decisions. Like all aspects of trading, patience, practice, and discipline are essential. By combining keen observation with a comprehensive strategy, tweezer patterns can become a reliable ally in navigating the complexities of financial markets.


