
Studying oscillators might seem tricky and overwhelming for novice traders. But if you’re interested in trading, it’s essential to understand how they work. In this article, I’ll tell you which oscillators are the best and how to use them effectively.
Oscillators in Technical Analysis
An oscillator is a technical analysis indicator that measures the speed and direction of price changes in an asset. It is displayed on a chart as a line that oscillates around a certain level, typically the zero line.
Oscillators are among the most popular tools in technical analysis. They help identify the overbought and oversold conditions of an asset, spot trends and trend reversals, as well as entry and exit points.
Top Oscillators
Let’s take a look at five popular technical indicators. Each of them has its own characteristics and advantages, but all of them can be useful in trading.
1. MACD (Moving Average Convergence Divergence)
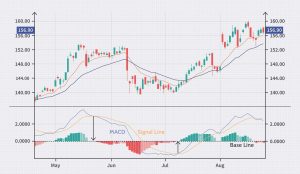
The MACD indicator is one of the most popular technical analysis tools. It helps traders identify the direction of a trend and spot trend reversals. MACD is calculated by subtracting two moving averages (usually 26-day and 12-day) and is displayed on the chart as a histogram.
In addition to calculating the two moving averages, MACD includes a third line called the signal line. Typically, this is a 9-day moving average. If the MACD line crosses above the signal line, it may signal the beginning of an uptrend, while a cross below the signal line might indicate the start of a downtrend.
Furthermore, MACD can assist in determining market overbought and oversold conditions. If the MACD reading is significantly above the zero line, it could suggest an overbought market, whereas if it’s below, it might indicate an oversold market.
2. RSI (Relative Strength Index)
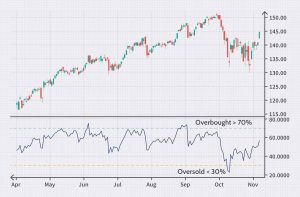
The RSI (Relative Strength Index) indicator was developed to measure the strength and direction of price movements in financial markets. It is used to determine market overbought or oversold conditions by comparing the relative strength of bulls and bears, calculated as the average price gain over a specific period of time. The typical period chosen is 14 days, but it can be adjusted to match preferences and the specific characteristics of the market. RSI values can range from 0 to 100. When the RSI value exceeds 70, it indicates that the market is overbought and prices may be overinflated. Conversely, if the RSI value drops below 30, it suggests the market is oversold, and prices may be undervalued.
3. Stochastic Oscillator
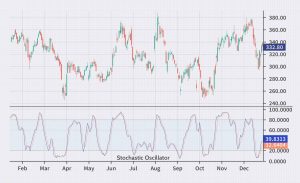
The indicator helps traders determine the level of relative price overbought or oversold conditions of an asset. It consists of two lines: the %K line and the %D line. The %K line displays the current price of the asset as a percentage of the highest and lowest price over a specific period, usually 14 days. The %D line is a moving average of the %K line and helps smooth out fluctuations, providing more accurate signals.
Typically, the Stochastic Oscillator comes with default settings of 14,3,3, where the first parameter pertains to the period used for calculating %K, and the other two parameters relate to the periods used for calculating %D. When the Stochastic Oscillator is above 80, it suggests that the asset is overbought, indicating a potential price fall. Conversely, when the indicator is below 20, it might indicate asset oversold conditions, suggesting a potential price increase.
Like other indicators, the Stochastic Oscillator should be used in combination with other tools of technical and fundamental analysis for more precise signals. Overall, the Stochastic Oscillator is a powerful indicator that can assist traders in making decisions in financial markets.
4. ADX (Average Directional Index)
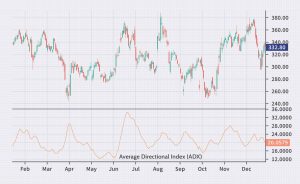
This indicator helps determine the strength and direction of the market trend. It’s calculated based on two other indicators – the Directional Movement Index (DMI) and the Directional Movement Index Rating (DMIR). ADX measures the trend strength based on the difference between the plus and minus values of DMI and DMIR. The ADX line is usually displayed on the chart and oscillates between 0 and 100. The higher the ADX value, the stronger the trend.
An ADX level of 25 is typically used to identify the beginning of a trend, while an ADX level of 50 is used to identify the strength of a trend. If the ADX value is above 50, it indicates a very strong trend, and the likelihood of its reversal is low. If the ADX value is below 20, it signifies the absence of a clear trend in the market.
Using ADX helps traders determine how strong or weak the current market trend is and decide whether to buy or sell an asset.
5. ROC (Rate of Change)
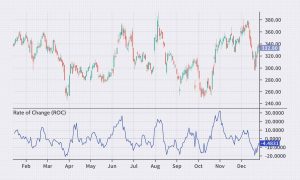
ROC is an oscillator that measures the rate of change in the price of an asset. It’s calculated as the ratio of the asset’s current price to the price of the asset N periods ago. ROC can be positive or negative, depending on whether the asset’s price has increased or decreased over the last specified period. ROC is commonly used to identify turning points in price trends. If ROC is above 0, it may indicate that the price of the asset is rising, and if ROC is below 0, it suggests that the price of the asset is falling.
ROC can be expressed as the percentage change in the price of an asset over a specific period of time. For instance, if the price of an asset was 100 rubles 10 days ago and today it’s 110 rubles, then the ROC would be 10%.
ROC can be used to compare different assets to determine which one is growing or declining more rapidly. Remember, ROC, like other oscillators, is not a universal tool and should be used in combination with other market analysis methods.
Advantages and Disadvantages of Oscillators
MACD, RSI, Stochastic Oscillator, ADX, and ROC are technical analysis tools that can help you decide when to buy or sell a particular asset, determine overbought or oversold conditions, identify current trends and spot potential reversals. Plus, ADX shows how strong a trend is, and ROC can help you find potential reversal points within the current trend.
However, there’s a fly in every ointment. Oscillators aren’t always precise and can generate false signals, especially during market fluctuations. They might be ineffective when the market is in a sideways trend, with prices oscillating within a narrow range. Interpreting oscillator signals requires skills and experience to use them correctly. But that’s not all. Oscillators can fail in certain market conditions like high volatility or low liquidity. Moreover, relying solely on oscillators might cause you to miss other crucial factors: news and events affecting asset prices.

How to Enhance Oscillator Performance?
To improve oscillator performance, consider these methods:
- Use Multiple Oscillators with Other Indicators: For instance, you can employ RSI and Stochastic Oscillator alongside Moving Averages to identify strong trends and overbought/oversold conditions.
- Adjust Periods for Different Oscillators Based on Strategy: Employ shorter periods for short-term strategies and longer ones for long-term strategies.
- Apply Filters to Reduce False Signals: Use tools like moving averages to confirm oscillator signals.
- Don’t Solely Rely on One Oscillator for Trading Decisions: Analyze price charts and other indicators such as trading volume and support/resistance levels.
I hope this overview helped you understand what oscillators are and how they can be beneficial. As my final recommendation, I suggest reading John Murphy’s book “Technical Analysis of the Financial Markets.” It helped me understand how oscillators work and refine my technical analysis skills. I genuinely recommend reading it and wish you success in financial markets!


