
Swing trading has become increasingly popular because it allows traders to profit from short- to medium-term price movements without constantly watching the markets. Unlike day trading, which involves multiple trades in a single day, swing trading focuses on capturing price swings over several days or weeks, offering a balance between active trading and long-term investing.
Indicators help traders identify trends, spot potential reversals, and determine the best entry and exit points for trades. By using these tools effectively, swing traders can make more informed decisions, improve timing, and manage risk. In this article, we’ll explore the top indicators that swing traders rely on and show how to use them in trading.
What Makes a Good Swing Trading Indicator
A good swing trading indicator is one that helps traders make clear and informed decisions in the market. By using them, market participants can identify trends and see whether an asset is likely to move upward or downward over the coming days. Additionally, such indicators should highlight potential reversals, alerting traders when a trend may be losing momentum or about to change direction.
A strong indicator also provides clear entry and exit points, helping you know exactly when to buy or sell to maximize gains and limit risks. Additionally, reliability across different market conditions is crucial, as no single indicator works perfectly in every scenario.
Top Indicators for Swing Trading
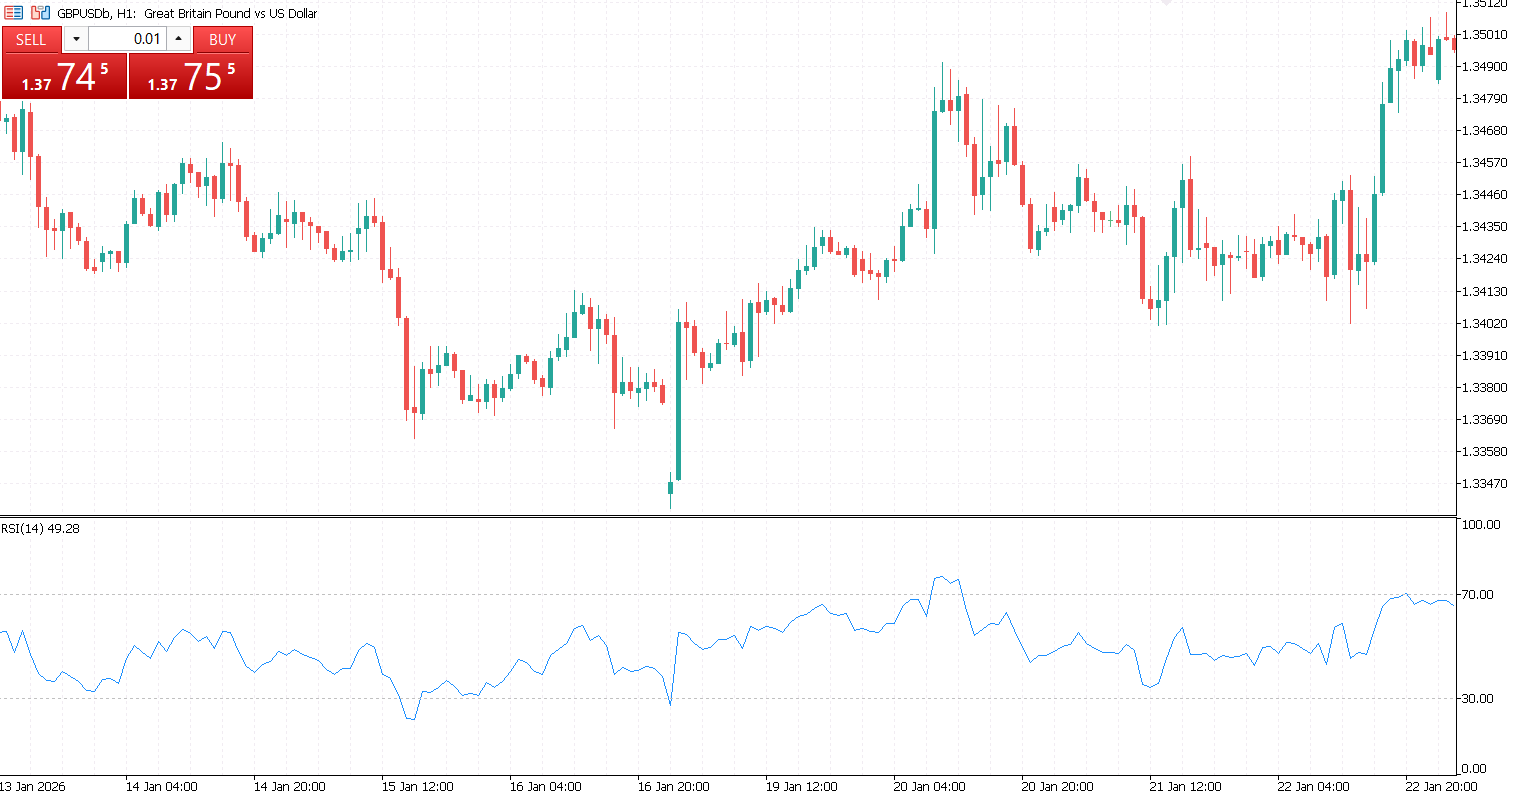
Moving Averages (SMA & EMA)
Moving averages are among the most popular tools for identifying trends. The Simple Moving Average (SMA) calculates the average price over a specific period, giving equal weight to each data point, while the Exponential Moving Average (EMA) gives more importance to recent prices, making it more responsive to current market movements.
Traders use moving averages to confirm trends and identify key signals, such as the golden cross, where a short-term average crosses above a long-term average, indicating bullish momentum, and the death cross, which signals potential bearish momentum.
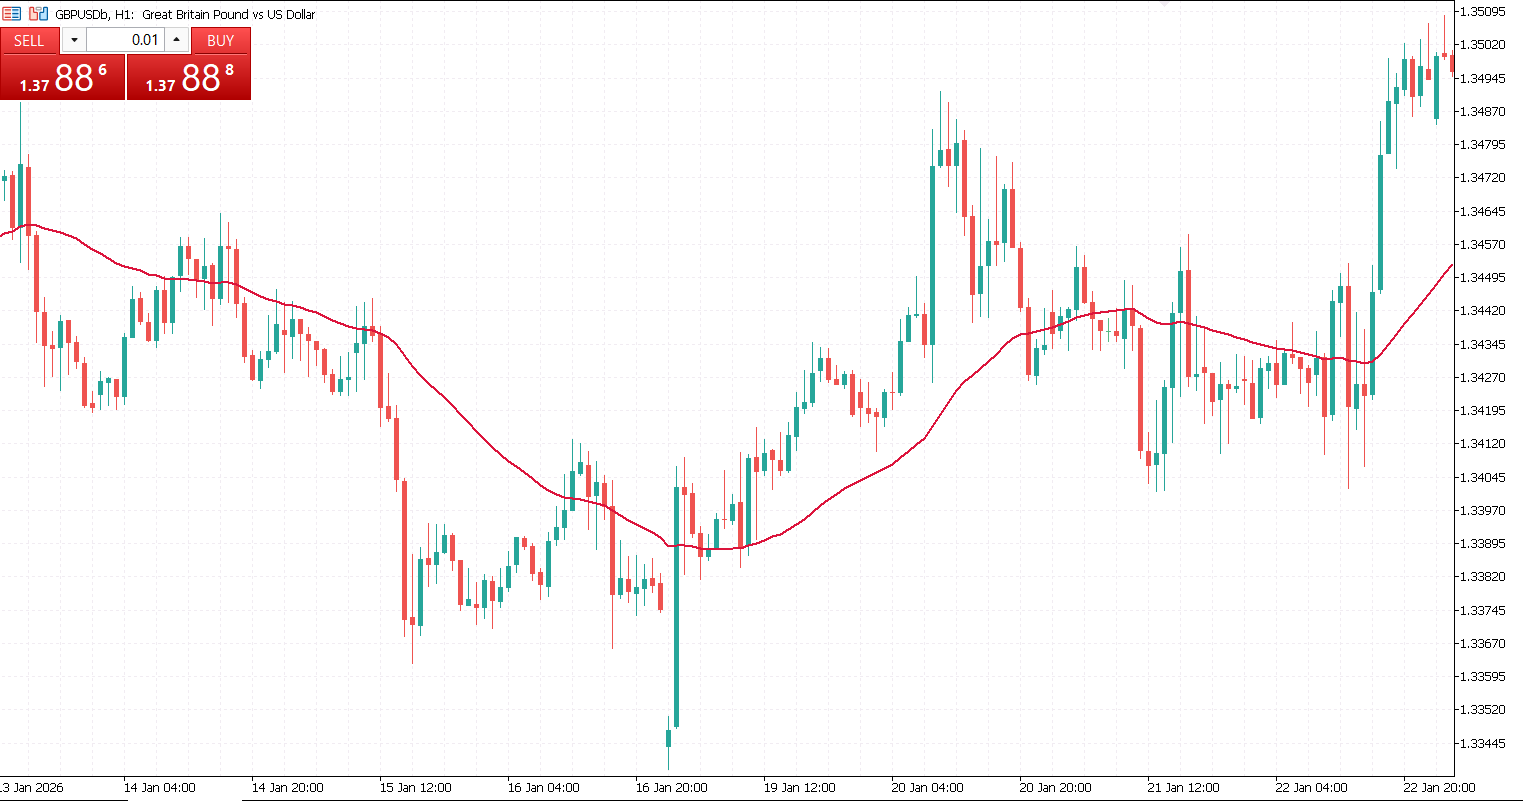
MACD (Moving Average Convergence Divergence)
The MACD compares two EMAs with different periods and plots the difference along with a signal line, providing insight into both momentum and trend direction. Crossovers of the MACD line with the signal line can indicate entry or exit points, while divergences between the MACD and price action may suggest weakening trends or potential reversals.
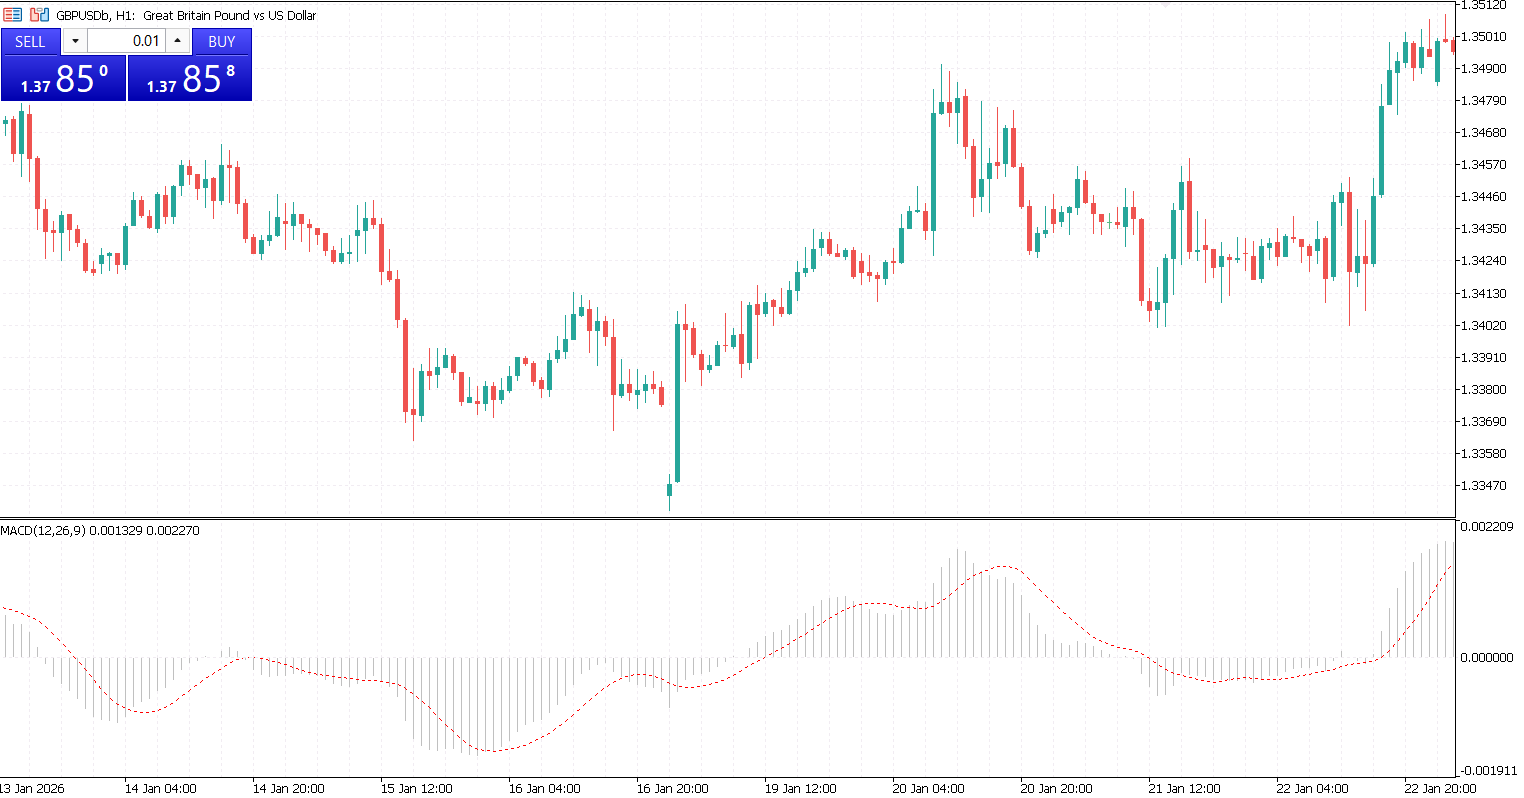
Relative Strength Index (RSI)
The RSI measures overbought or oversold conditions on a scale from 0 to 100. Readings above 70 often indicate overbought conditions, signaling a potential pullback, while readings below 30 suggest oversold conditions, presenting potential buying opportunities. Divergences between RSI and price can also highlight weakening trends or imminent reversals.
Stochastic Oscillator
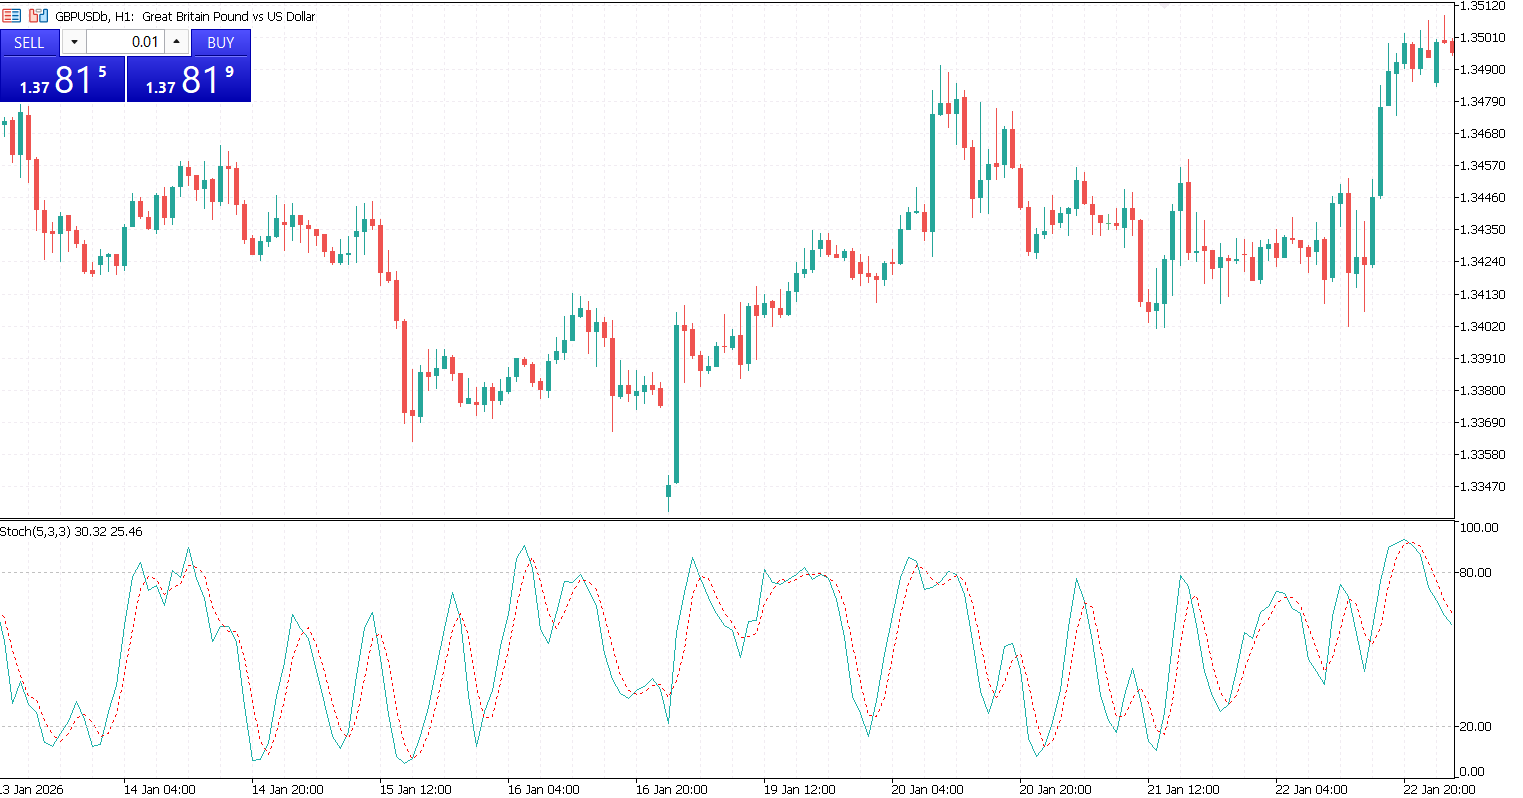
The Stochastic Oscillator compares an asset’s closing price to its price range over a set period, providing insight into momentum. When used alongside the RSI, it can confirm overbought or oversold conditions and refine entry and exit decisions, giving traders stronger signals for timing trades.
Bollinger Bands
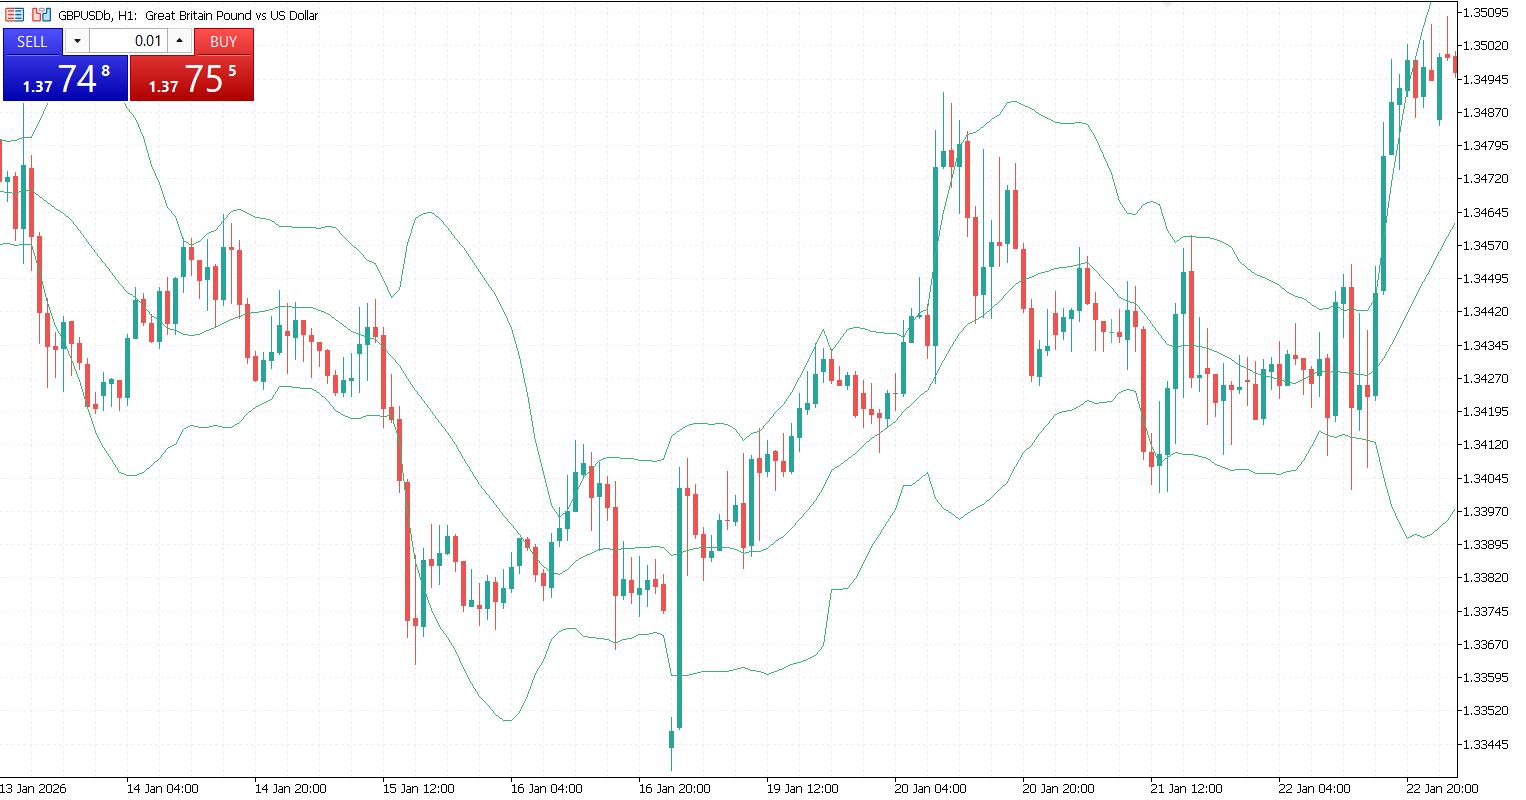
Bollinger Bands consist of a moving average with upper and lower bands set at standard deviations from the average. The bands expand and contract with price volatility, helping traders find potential reversals or breakout opportunities when prices touch or move beyond the bands.
Average True Range (ATR)
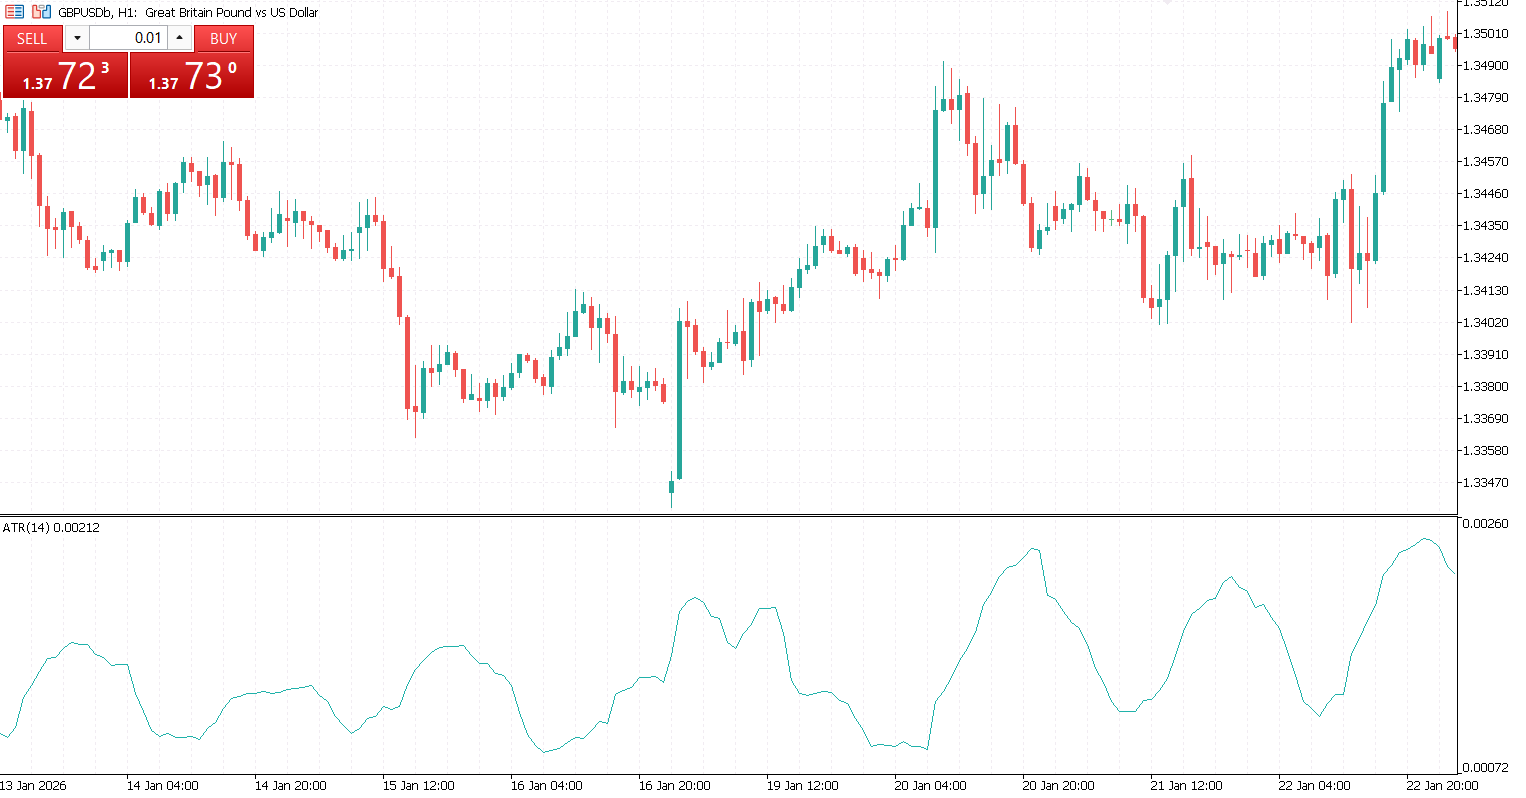
The ATR measures market volatility by calculating the average range of price movements over a set period. Swing traders use ATR to gauge how volatile a market is and to determine position sizes and stop-loss levels, ensuring trades are adjusted to the current market conditions.
Combining Indicators for Higher Accuracy
No single indicator is perfect. Each provides a different perspective on the market, and relying on just one can lead to false signals or missed opportunities. By combining indicators, swing traders can confirm signals, reduce risk, and increase the probability of making successful trades.
RSI + MACD
Pairing the RSI with the MACD is a common strategy. The RSI identifies overbought or oversold conditions, while the MACD provides confirmation of trend direction and momentum. For example, a trader might look to buy when the RSI signals oversold conditions and the MACD line crosses above its signal line, confirming upward momentum.
Moving Average + Bollinger Bands
Combining moving averages with Bollinger Bands helps traders spot trends and gauge volatility at the same time. A price crossing above a moving average while touching the lower Bollinger Band might indicate a potential reversal, providing a clear entry point for a swing trade.

Tips for Using Indicators Effectively
Using indicators effectively requires preparation and discipline. Before trading live, it’s important to test strategies, customize indicator settings, and track results to improve consistency and confidence.
- Backtest strategies before trading live. Before applying any indicator in real-time trading, it’s essential to backtest your strategy using historical data. This allows you to see how your chosen indicators would have performed in past market conditions, helping you identify strengths, weaknesses, and potential pitfalls without risking real money.
- Adjust settings for your trading style. Indicators are not one-size-fits-all. Adjusting settings such as time periods or sensitivity levels can make an indicator more suited to your trading style and timeframe. For example, a shorter EMA may be better for capturing quick swings, while a longer EMA can help confirm major trends in slower-moving markets.
- Keep a trading journal. Maintaining a trading journal is invaluable for tracking which indicators and combinations work best for you. Record entry and exit points, market conditions, and the outcomes of trades. Over time, this practice helps refine your strategy, improves decision-making, and increases consistency in your swing trading performance.

Indicators play a crucial role in swing trading by helping traders identify trends, spot potential entry and exit points, and manage risk more effectively. While no single indicator guarantees success, the right combination can give traders a clearer perspective on market movements and enhance decision-making.
It’s important to experiment and find the mix of indicators that aligns with your personal trading style, risk tolerance, and goals. What works for one trader may not work for another, so testing and adaptation are essential.


