
Moving Average (MA) is one of the most popular technical indicators, allowing traders of all experience levels to view smoothed price data, identify market trends, and monitor market behavior. Traders often adjust the period of the indicator to make it more effective for different trading strategies.
However, simply changing this parameter is unlikely to significantly improve a trading system. Traders should understand how a specific period affects the behavior of the indicator and how it can be used to their advantage. This article explores the most popular moving average periods and how they can be applied to different trading styles.
Moving Average Period Explained
A moving average period is the number of data points used to calculate the average price. For example, a 20-period moving average on a daily chart shows the average closing prices over the past 20 days. As new data points are added, older values drop off, creating a continuously updating line known as a moving average.
Shorter periods make the MA more responsive to price fluctuations but generate more noise. Longer periods react more slowly to price changes but provide a clearer picture of the overall trend. The key idea is to learn how to find the right balance between the two.
Shortest Moving Averages
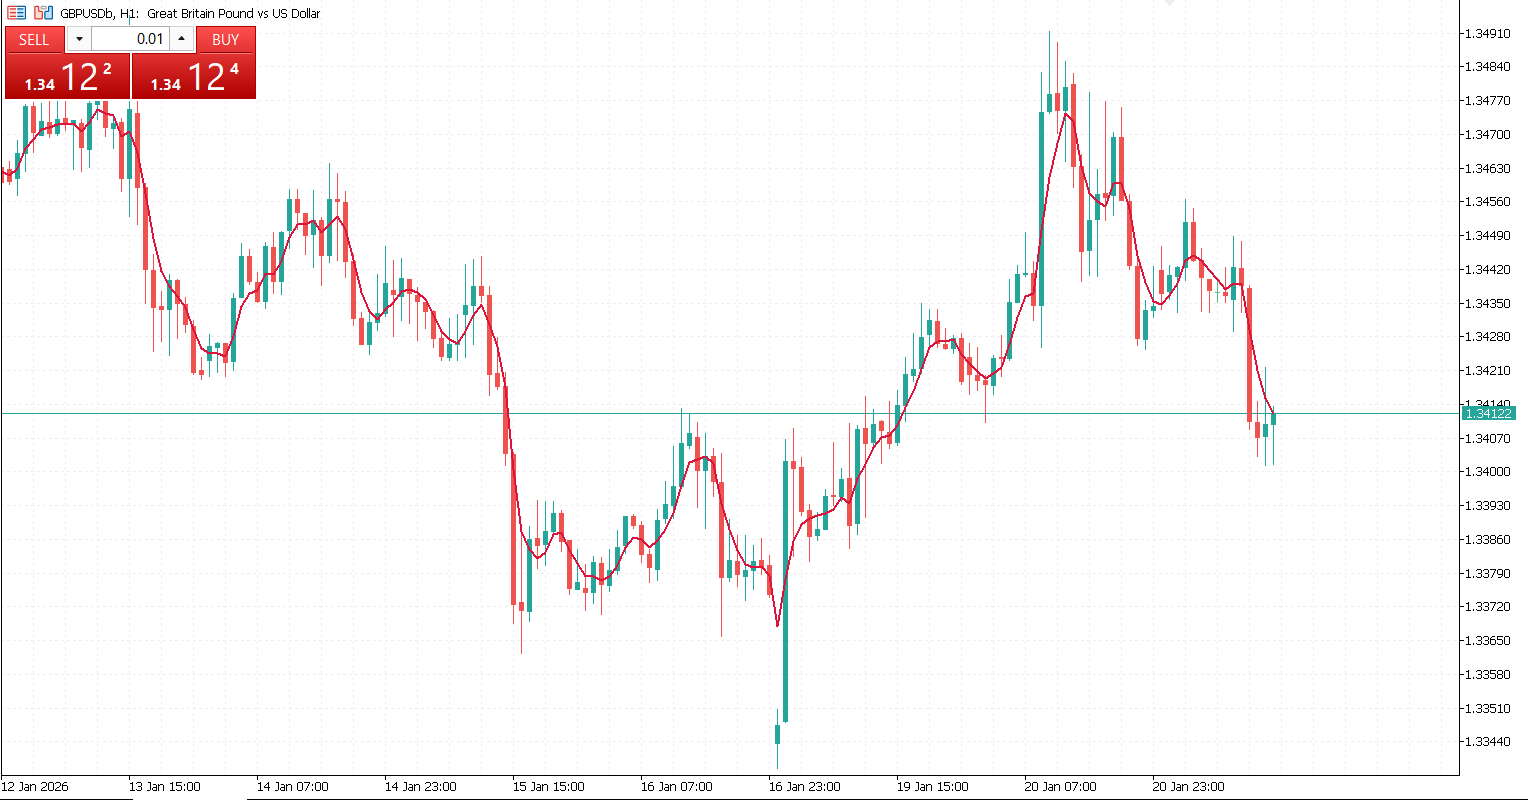
Scalpers and active intraday traders often use 5-period or 10-period moving averages, as these lines closely track price action. Such short periods are useful for identifying momentum bursts, pinpointing entry and exit points, and tracking short-term, or micro, trends.
On the other hand, the increased sensitivity of the indicator makes traders more vulnerable to false signals, especially in range-bound markets. As a result, traders often combine short-period moving averages with longer-period MAs for confirmation.
Short-Term Moving Averages
Intraday traders often use 20-period and 30-period moving averages across various markets. These settings strike a balance between flexibility and stability by reducing market noise. They are well suited for swing traders and those who follow short-term trends.
Such MA settings help traders identify short-term trends, use the moving average as dynamic support or resistance, and generate crossover signals when combined with another MA of a higher or lower period.
Medium-Term Moving Averages
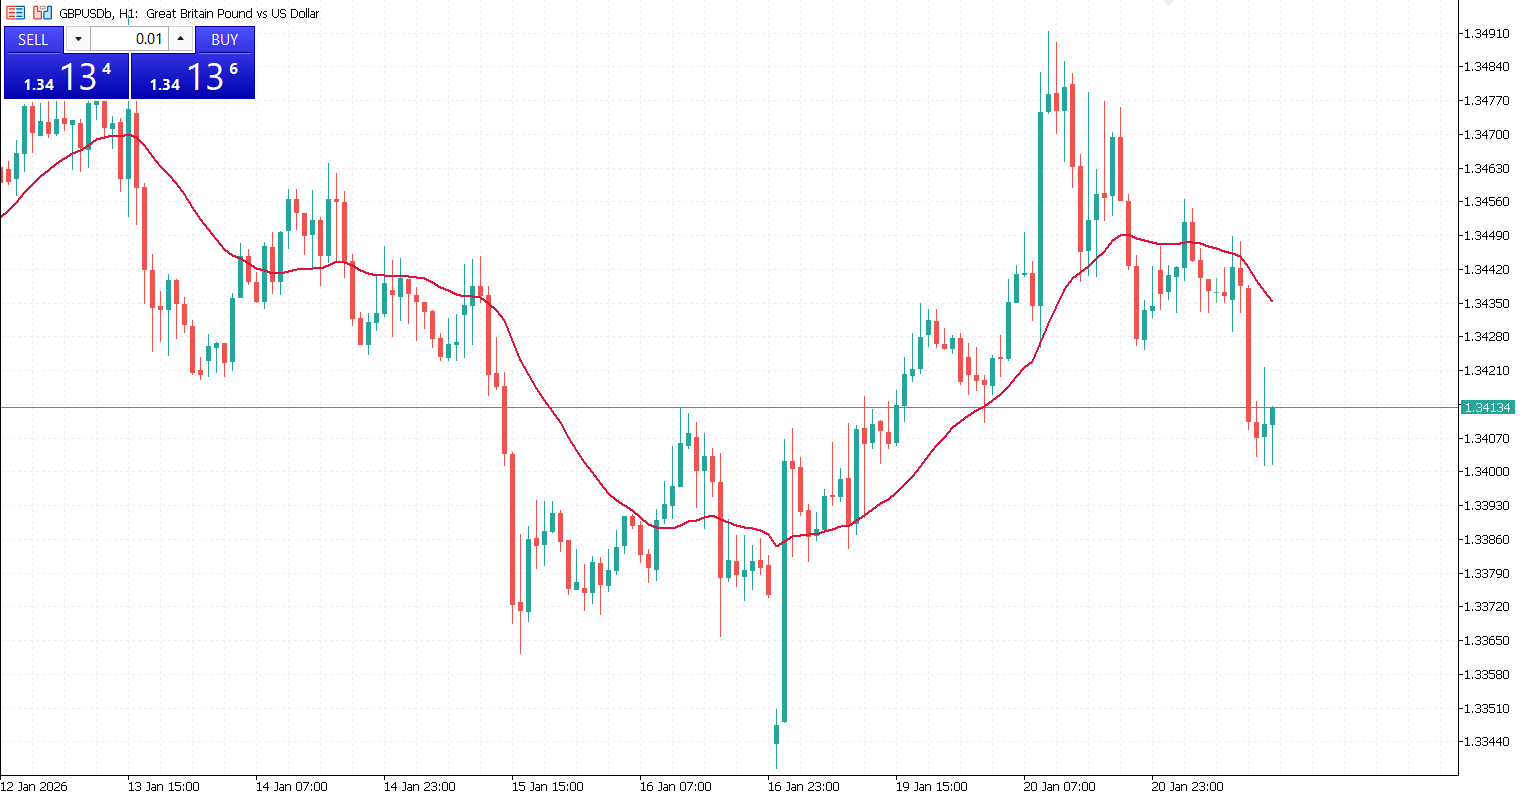
The 50-period moving average (MA50) is often used by traders as a benchmark indicator, providing insight into the medium-term trend. This moving average is widely recognized by both traders and investors and carries significant psychological influence.
When the price stays above the MA50, it signals an uptrend. Conversely, if the price breaks below this line, it indicates a shift to a bearish trend.
Long-Term Moving Averages
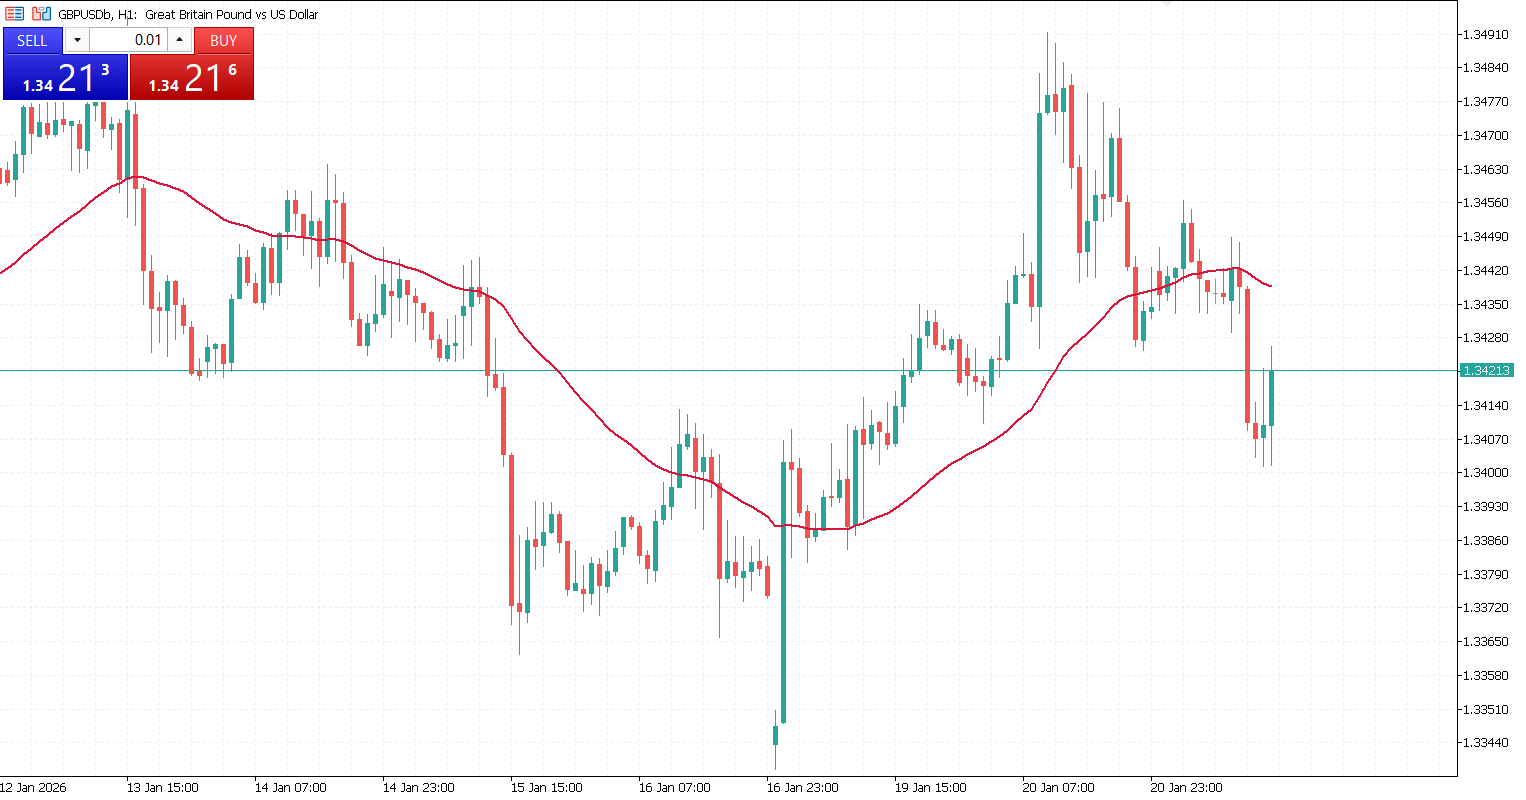
Long-term moving averages, especially the 200-period MA (MA200), are among the most widely used indicators. They help traders identify long-term trends across various timeframes. The MA200 is smooth and stable, providing strong support and resistance levels and clearly distinguishing bullish from bearish market conditions.
Combining Moving Averages of Different Periods
Traders often combine moving averages of different periods to identify trading opportunities. This approach helps pinpoint entry and exit points, track market momentum, and anticipate potential reversals.

Short-Term and Medium-Term Moving Averages
Short- and medium-term MAs are often paired to improve the precision of entries and exits. For example, a trader might combine a 10-period MA with a 50-period MA. The short-term MA reacts quickly to price changes, while the medium-term MA filters out market noise.
Using this combination allows traders to implement crossover strategies, which are popular in momentum and swing trading. This method helps capture smaller directional price movements within ongoing trends.
Medium-Term and Long-Term Moving Averages for Trend Confirmation
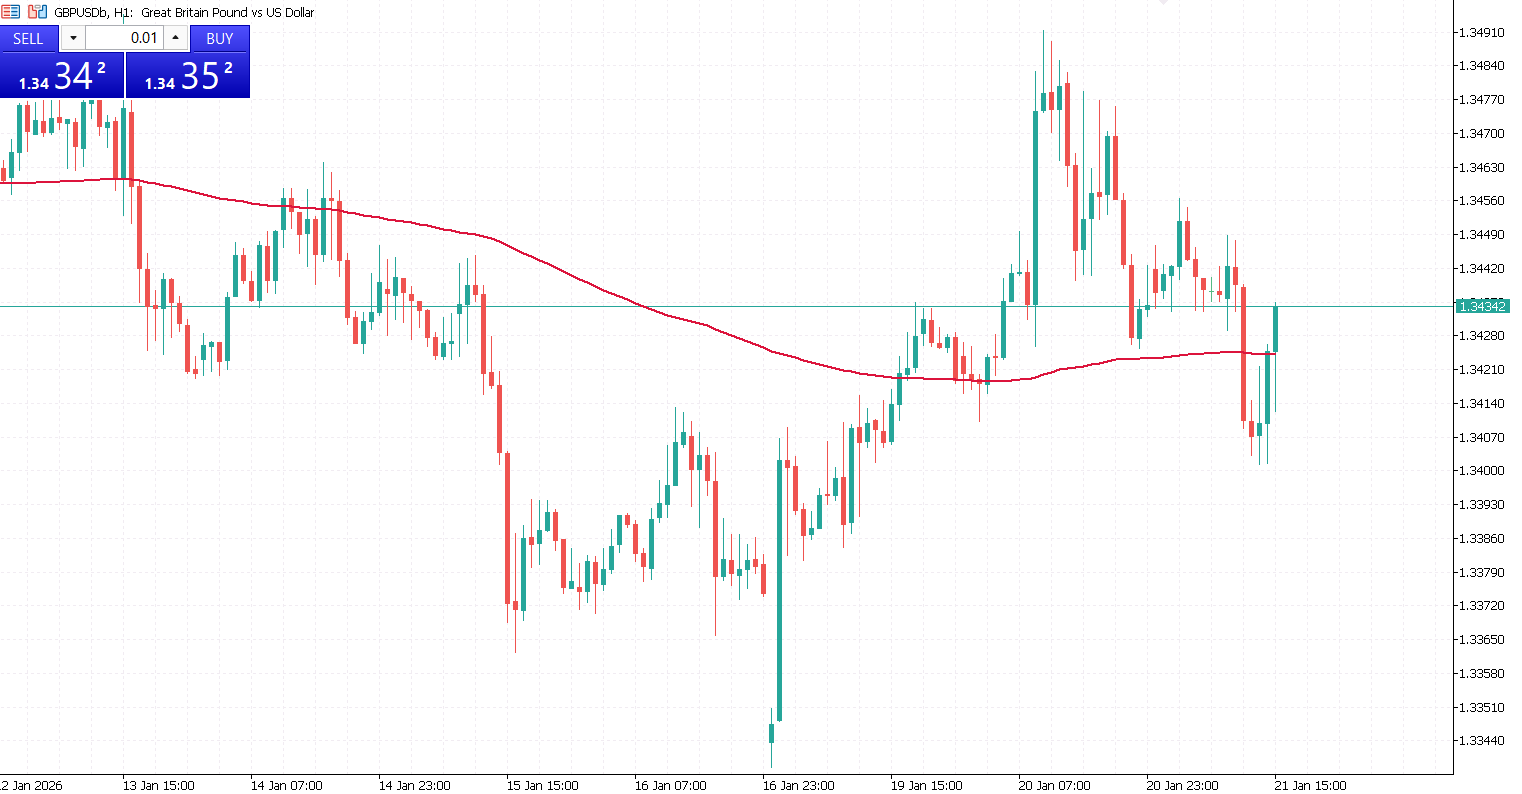
Combining medium-term and long-term moving averages is commonly used to confirm major market trends. Popular medium-term MAs include 50 and 100 periods, while long-term MAs typically include 100 and 200 periods.
When a faster MA crosses above a slower MA, it forms a golden cross, signaling strong buyer pressure. Conversely, when the faster MA crosses below the slower MA, a death cross appears, signaling selling pressure. This approach focuses on major trends rather than short-term fluctuations and is primarily used by position traders following trend-based strategies.

Triple Moving Average Combinations
Some traders use a triple MA setup, combining short-term, medium-term, and long-term MAs. For example, using 10-, 50-, and 100-period MAs provides a comprehensive view of the market.
- When all three MAs align upward, it indicates a strong bullish trend.
- When they align downward, it suggests sellers are dominating.
This approach balances sensitivity to short-term price changes with trend confirmation, helping reduce false signals that may occur when using only two MAs.
Moving average periods are far more than simple numbers, they represent different perspectives on market behavior. Short periods capture speed and momentum, medium periods define structure, and long periods reveal the underlying trend. No single moving average period is universally superior; its effectiveness depends on the market, timeframe, and trading objective.
By understanding how various moving average periods behave and how they interact with price, traders can make more informed decisions, reduce noise, and improve overall market analysis. Mastery comes not from using more indicators, but from using the right periods with clarity and purpose.


