
Hammer is among the most popular price action trading patterns, and it can frequently be found on charts for Forex currencies, stocks, commodities, or even cryptocurrencies. With these patterns, traders can pinpoint potential market reversals. Hammer-like patterns are popular because of their simple structure and effectiveness in forecasting price movements. Whatever type of trader uses them, hammer-like patterns can enhance their decision-making process and improve their overall strategy.
This article will explore the most popular hammer-like candlestick patterns, including the classic hammer, inverted hammer, hanging man, and shooting star. We will also explain how each signals potential trend shifts and how to trade them effectively.
Classic Hammer Pattern
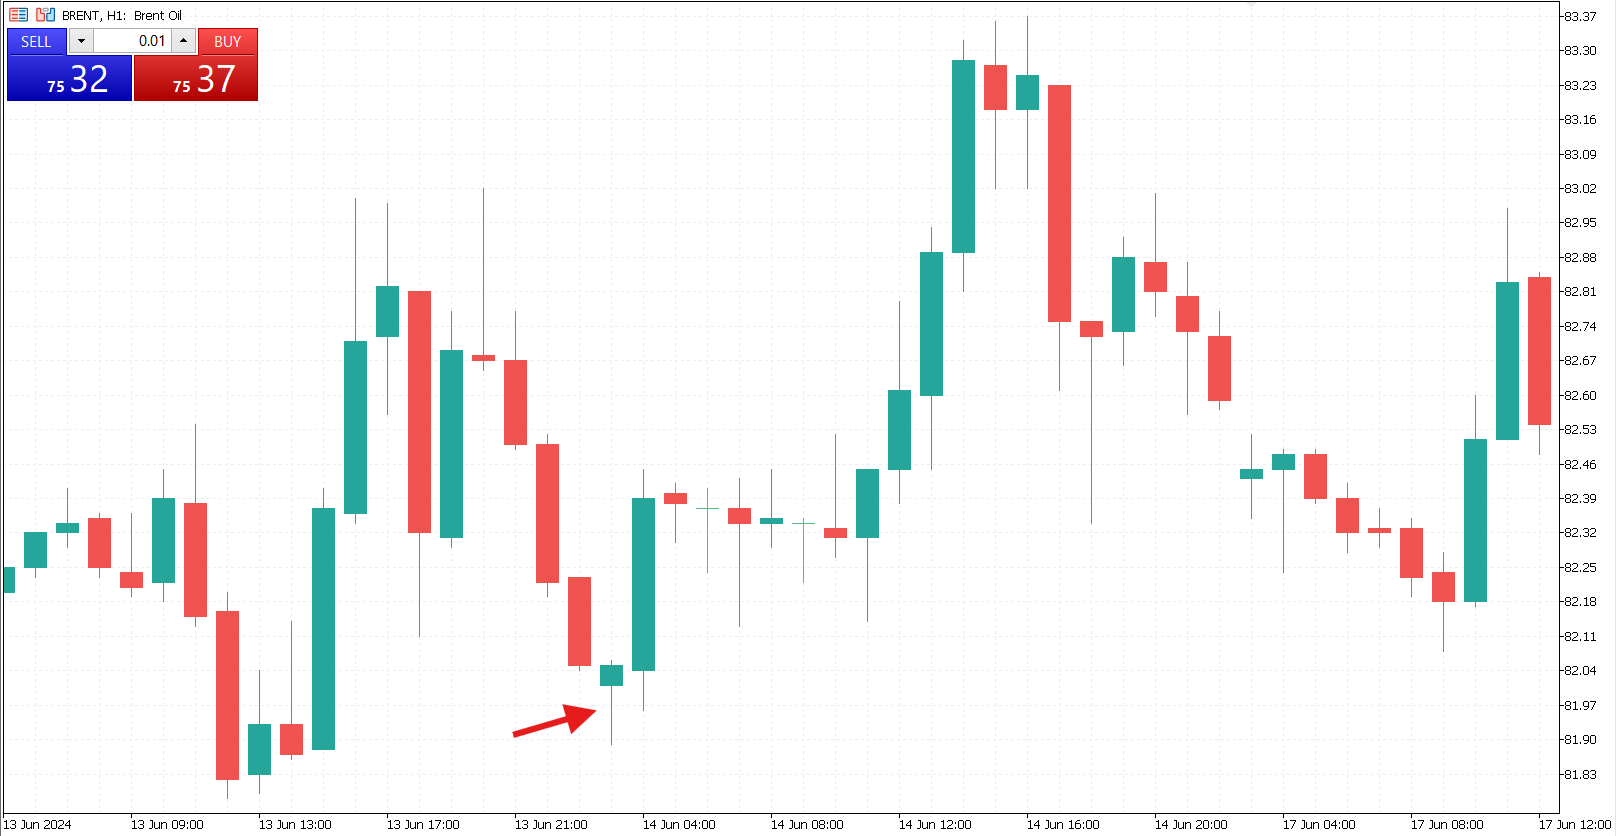
The hammer is a bullish pattern that typically appears at the end of a downtrend. It has a petite body and a long lower tail. The name comes from its shape, which resembles the famous tool. The long tail reflects sellers’ inability to lower prices while buyers take control. The small body reflects uncertainty and indecision.
One fundamental factor traders should consider when trading with the hammer pattern is its position on the chart. First, the pattern should form after the downtrend. Second, it should appear at the support level. The stronger the support, the better, as there are more chances that the price will reverse after hitting this area.
Moreover, the strength of the signal is defined by the appearance of the hammer pattern itself. Those with longer lower wicks and smaller bodies are more likely to predict the near-term reversal.
To trade the hammer pattern, one can wait until the next candlestick appears and breaks the upper point of the hammer candlestick. This is a clear buy signal. To mitigate risks, a trader can place a stop-loss order below the lowest point of the pattern.
Inverted Hammer
The inverted hammer is another reversal pattern formed at the support level after a downtrend. However, its appearance is quite different from that of the regular hammer. It has a small body at the bottom and a long tail at the top.
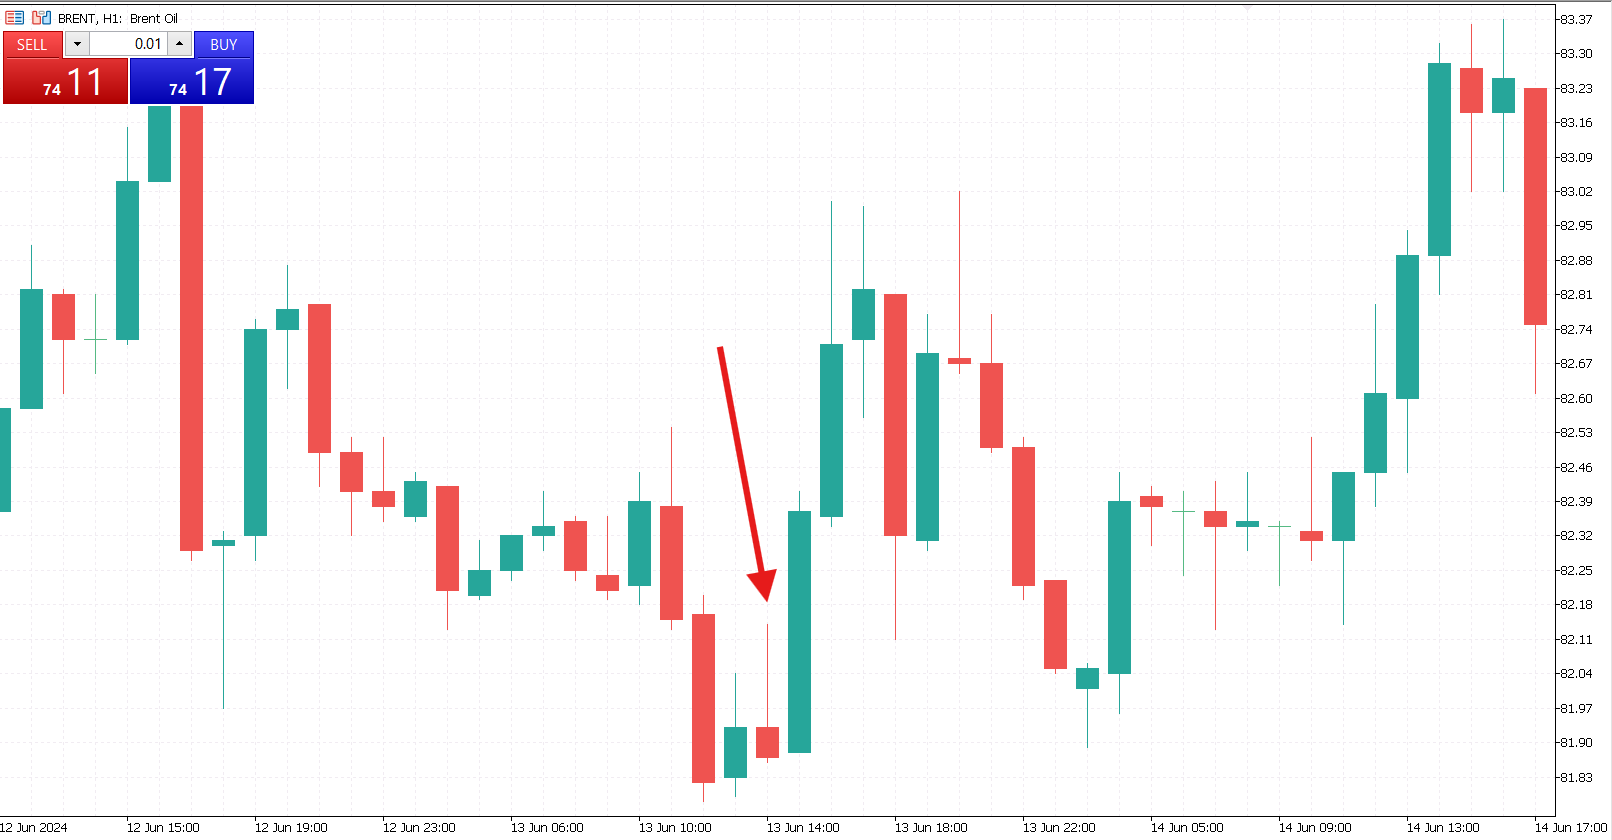
The psychology behind this pattern lies in its long upper shadow. Buyers managed to push the price higher during the session. However, they could not hold their positions, and sellers fought back. The fact that the price was higher during the period indicates that bulls are gaining control and the downtrend is about to end.
Traders often wait for a confirmation before entering the market. To buy an asset, watching the next bullish candlestick is better. Once the upper point of the inverted hammer candlestick is broken, one can place a trade. To mitigate risks, traders can place stop-loss orders below the lower end of the inverted hammer pattern. This will protect market participants from continued bearish momentum or false signals that may occur.
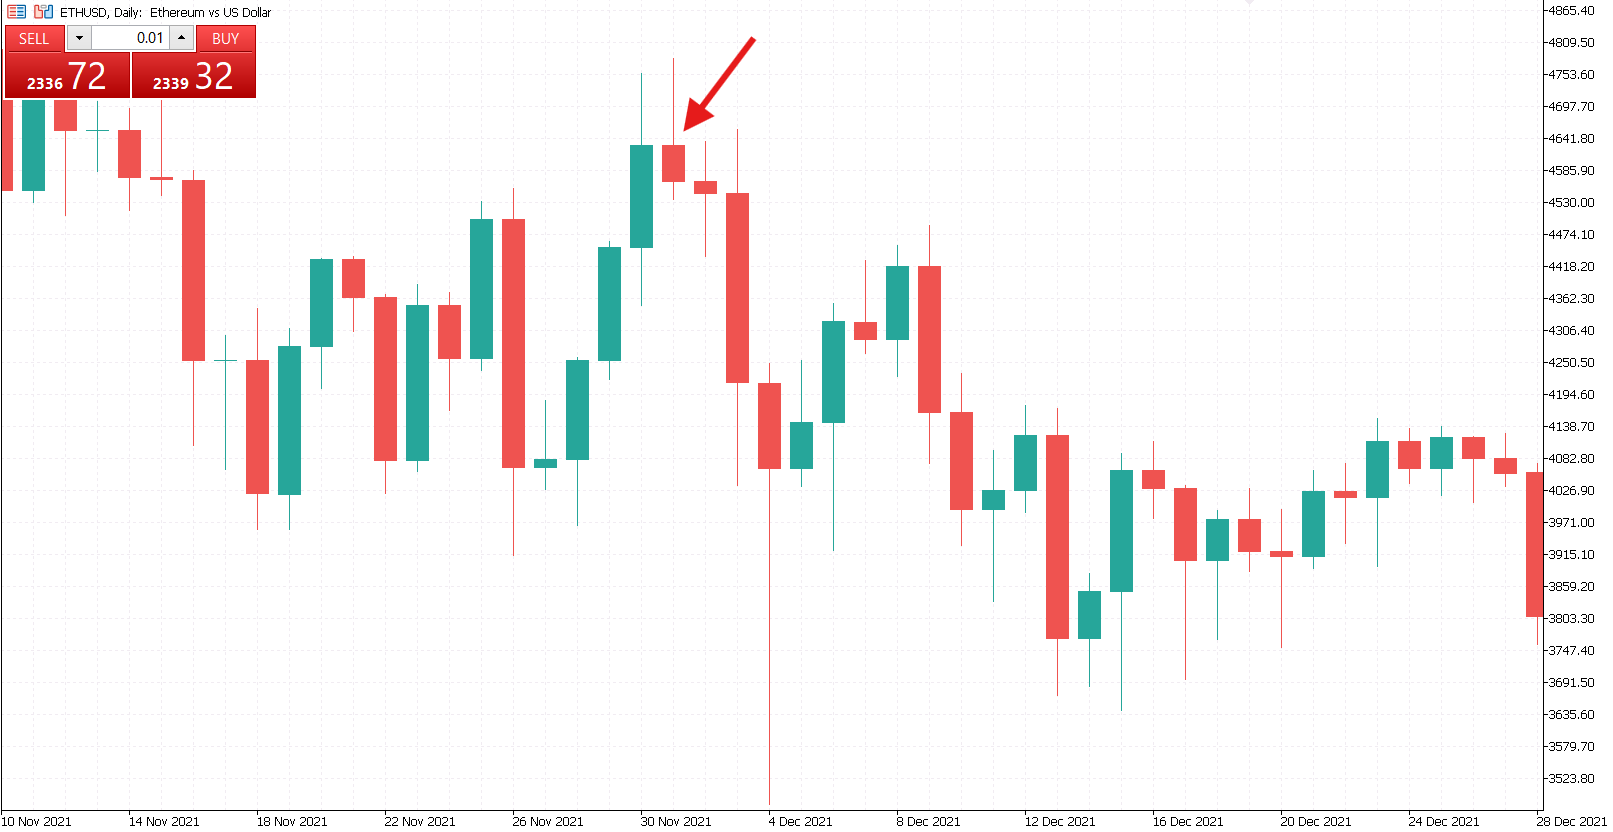
Hanging Man
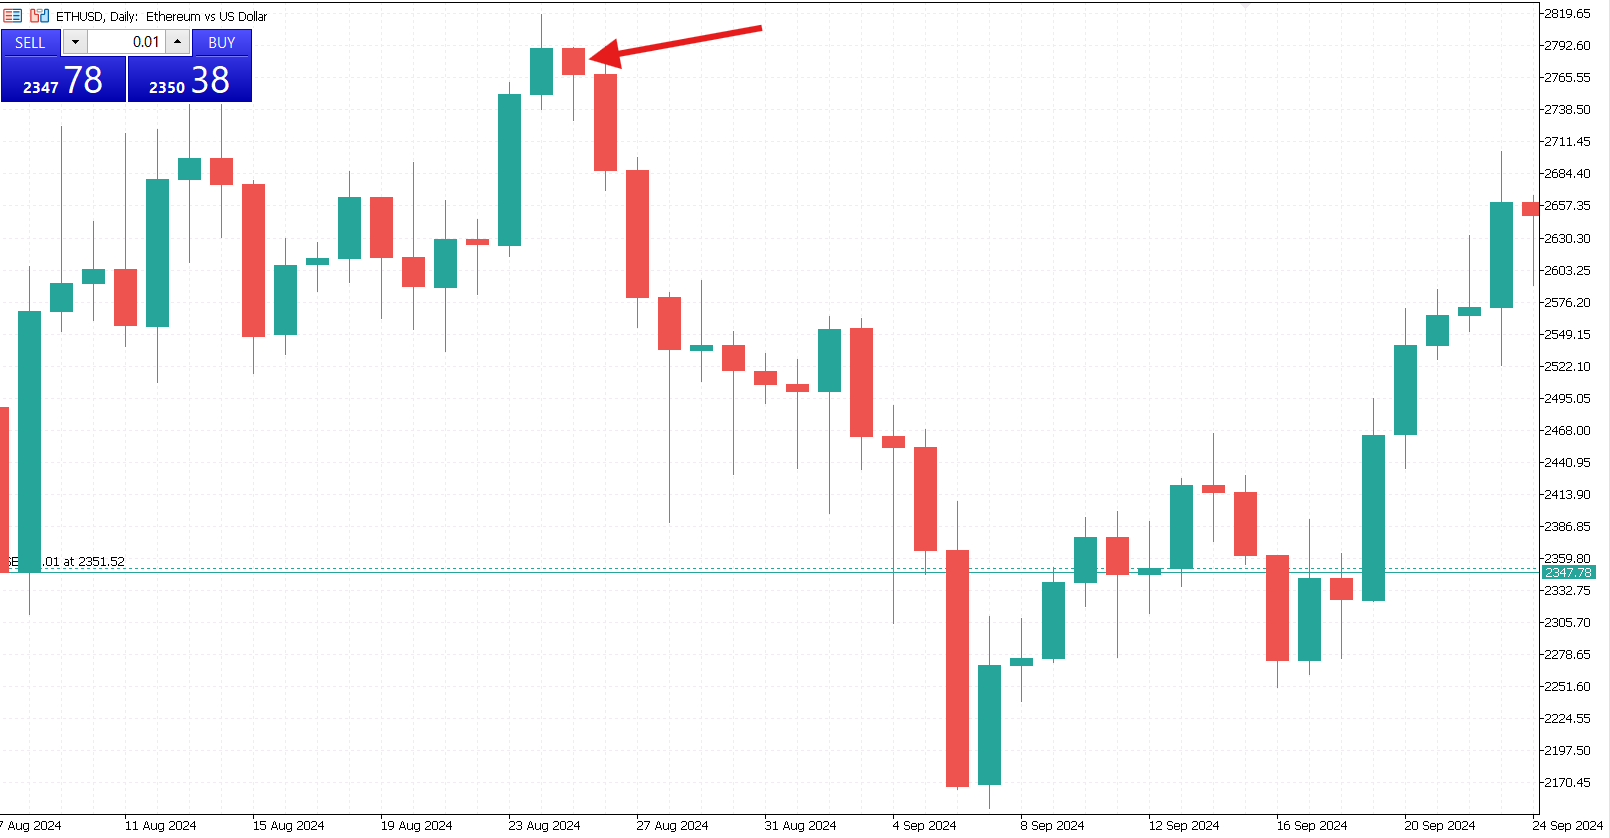
Unlike the two previous patterns, the hanging man is a reversal model that appears at the top of the uptrend. Visually, it is identical to the hammer or inverted hammer. However, the main difference between it and the hammer is that the hanging man is at the resistance level. The long lower wick indicates that the bears tried to gain control but failed, and the price moved close to the opening level.
Anyway, the seller pressure that appeared when this candlestick was forming signals a potential correction of a full-fledged correction in the market. A trader should focus on the context when interpreting the hanging man pattern. The candlestick resembles the hammer pattern, which may confuse market participants. It is essential to check the position of the setup. It should be located at the top of the uptrend.
Traders often look for confirmation when dealing with the hanging man pattern. Before selling an asset, they check whether the next candlestick confirms the pattern, which should be bearish and break the lowest point of the hanging man’s body. Once this happens, a trader can go short and place a stop-loss order above the highest point of the hanging man pattern.
Shooting Star
This is another reversal pattern that appears at the resistance level. Unlike the hanging man, the shooting star has a long upper shadow and a small body near the lower end. There is no or a small shadow below the body.
The psychology behind this pattern is elementary. Buyers attempted to increase the price, but the sellers pushed the price lower. The pattern marks the peak of the uptrend.
To trade this pattern, traders must wait until the second candlestick breaks below the lowest point of the shooting star. Once this happens, one can sell an asset. The stop-loss order can be placed right above the highest point of the pattern.
Hammer-like patterns are essential tools in the technical analysis toolkit. Each pattern provides unique insight into potential market reversals and signal shifts in market sentiment depending on their formation and position within a trend.
The hammer and inverted hammer patterns, often found at the bottom of a downtrend, indicate potential bullish reversals, offering traders an opportunity to enter a long position as the market moves upward. On the other hand, the hanging man and shooting star patterns, which typically occur at the top of an uptrend, signal potential bearish reversals, alerting traders to the possibility of an impending market downturn.
Mastering the recognition and interpretation of these patterns allows traders to navigate market trends more effectively and make better-informed trading decisions. When combined with proper risk management and additional confirmation from other technical indicators or support and resistance levels, hammer-like patterns can significantly enhance a trader’s ability to precisely time entries and exits. By understanding the underlying market psychology behind these formations, traders can develop a sharper edge in their trading strategies.


