
The head and shoulders pattern is one of the most recognizable and reliable chart formations in trading. Its popularity stems from its ability to signal trend reversals, giving traders a clear visual cue about potential market shifts. But this pattern is more than just an image on a chart; it reflects the ebb and flow of market forces, helping traders anticipate what’s coming next. In this article, we will explore everything traders need to know about the head and shoulders pattern, including how to identify it, its psychology, trading strategies, common mistakes to avoid, and how to integrate it into a trading plan.
What is the Head and Shoulders Pattern?
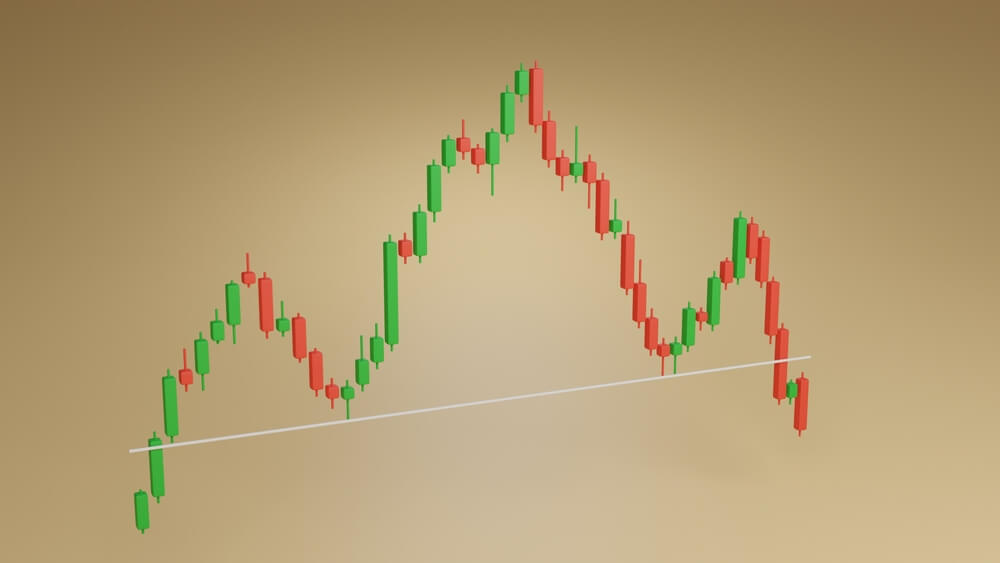
The pattern comprises three distinct peaks: the left shoulder, the head, and the right shoulder. The left shoulder forms after a price surge, followed by a decline. The head is created when the price climbs again to a higher peak, only to fall once more. Finally, the right shoulder forms when the price rises again but doesn’t reach the height of the head, then drops, indicating a potential trend reversal from an uptrend to a downtrend.
At the core of this pattern is the neckline, which connects the lows of the left shoulder, head, and right shoulder. The slope of the neckline, whether upward, downward, or horizontal, provides key insights. Traders look for a break below the neckline, as it typically signals the beginning of a new downtrend.
The Psychology Behind the Head and Shoulders Pattern
The head and shoulders pattern isn’t just a chart formation. It’s a visual reflection of changing market sentiment. When the left shoulder forms, it shows the first signs of weakening in an uptrend. As the price reaches the head, there’s still bullish momentum, but it’s often not as strong as earlier in the trend.
The real warning sign for bullish traders comes with the formation of the right shoulder, where the price fails to reach the previous high. The decline from the head to the neckline is often much sharper and more aggressive, signaling that bears are gaining strength. Market sentiment has fully shifted once the price breaks below the neckline, and traders interpret this as confirmation that the uptrend has ended.

Inverse Head and Shoulders: A Bullish Signal
While the standard head and shoulders pattern signals a bearish reversal, the inverse head and shoulders pattern signals a potential bullish reversal. It forms at the end of a downtrend and shows that bearish momentum is fading, with bulls starting to take control. The right shoulder is the first sign of strength, as the price makes a higher low. A break above the neckline confirms the shift to a bullish trend.
Trading the Head and Shoulders Pattern
To trade the head and shoulders pattern effectively, timing is everything. Here are a few key considerations for success:
- Entry points. Traders typically enter a short position when the price breaks below the neckline in a standard head and shoulders pattern. Some traders wait for a retest of the neckline before entering, as the initial breakout can sometimes be volatile.
- Stop losses. Placing a stop-loss order is crucial to managing risk. Most traders place it above the right shoulder in a standard pattern or below the right shoulder in an inverse pattern. Aggressive traders may place it just above the neckline, though this increases the risk of being stopped out by volatility.
- Profit targets. The price target for the head and shoulders pattern is usually determined by measuring the distance from the head to the neckline and projecting that same distance downward from the neckline in the case of a standard pattern.
Common Mistakes When Trading the Head and Shoulders Pattern
Trading the head and shoulders pattern can be highly effective, but there are some common pitfalls to watch out for:
- False signals. Not every head and shoulders pattern results in a reversal. Always wait for a clear break of the neckline with increased volume to confirm the move.
- Over-reliance on the pattern. Don’t depend solely on the head and shoulders pattern. Combine it with other technical tools, such as trend lines, moving averages, and momentum indicators, to confirm your analysis.
- Ignoring market context. The broader market context matters. A head and shoulders pattern within a strong trend may not play out as expected. Always assess the overall market conditions and any relevant news or events.
- Poor risk management. Always use stop-loss orders and be clear about your risk tolerance. Without proper risk management, even a valid head and shoulders pattern can lead to significant losses if the market moves against you.
- Misinterpreting volume. A neckline break without a corresponding increase in volume may not sustain the trend reversal. Look for strong volume to confirm the breakout.
- Entering prematurely. Patience is key. Ensure the pattern is fully formed and the neckline has been broken before entering a trade.
Mastering the head and shoulders pattern can give traders a significant advantage in the market. Traders can greatly improve their decision-making by understanding its structure, its psychology, and the correct trading strategies. Remember to confirm the pattern with a clear neckline break, manage your risk with proper stop-loss levels, and avoid common mistakes like acting on false signals or over-relying on the pattern alone.
Incorporating the head and shoulders pattern into your broader trading strategy and other technical analysis tools can lead to more informed and successful trades. By practicing patience and focusing on comprehensive analysis, you’ll be better equipped to harness the power of this classic chart pattern.


