
Supply and demand zones are one of the most important concepts in price action trading and are widely used by both beginners and professional traders. Instead of focusing on indicators that lag behind price, this approach is based on understanding where strong buying or selling pressure previously appeared in the market.
These zones represent areas where large orders were likely executed, causing sharp moves in price. When the market returns to these areas, traders watch closely for potential reactions such as reversals, consolidations, or breakouts. Learning how supply and demand zones work can significantly improve a trader’s ability to read market structure, time entries more effectively, and manage risk with greater precision.
What Are Supply and Demand Zones?
A supply and demand zone is not a single price level but rather a broader area on the chart where price previously reacted strongly.
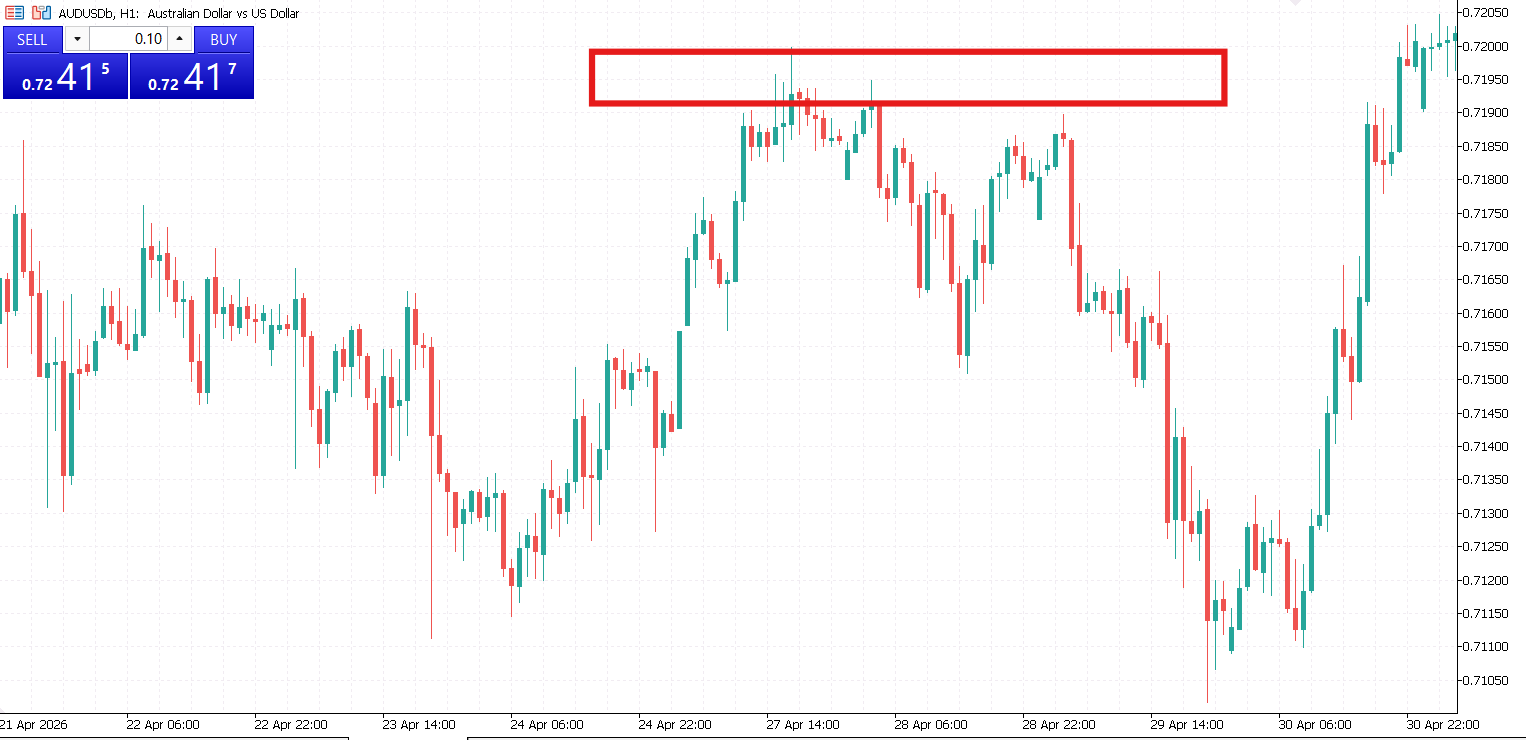
A supply zone is an area where selling pressure outweighed buying pressure, causing prices to drop sharply. It represents a region where sellers were dominant and where new sell orders may still exist.
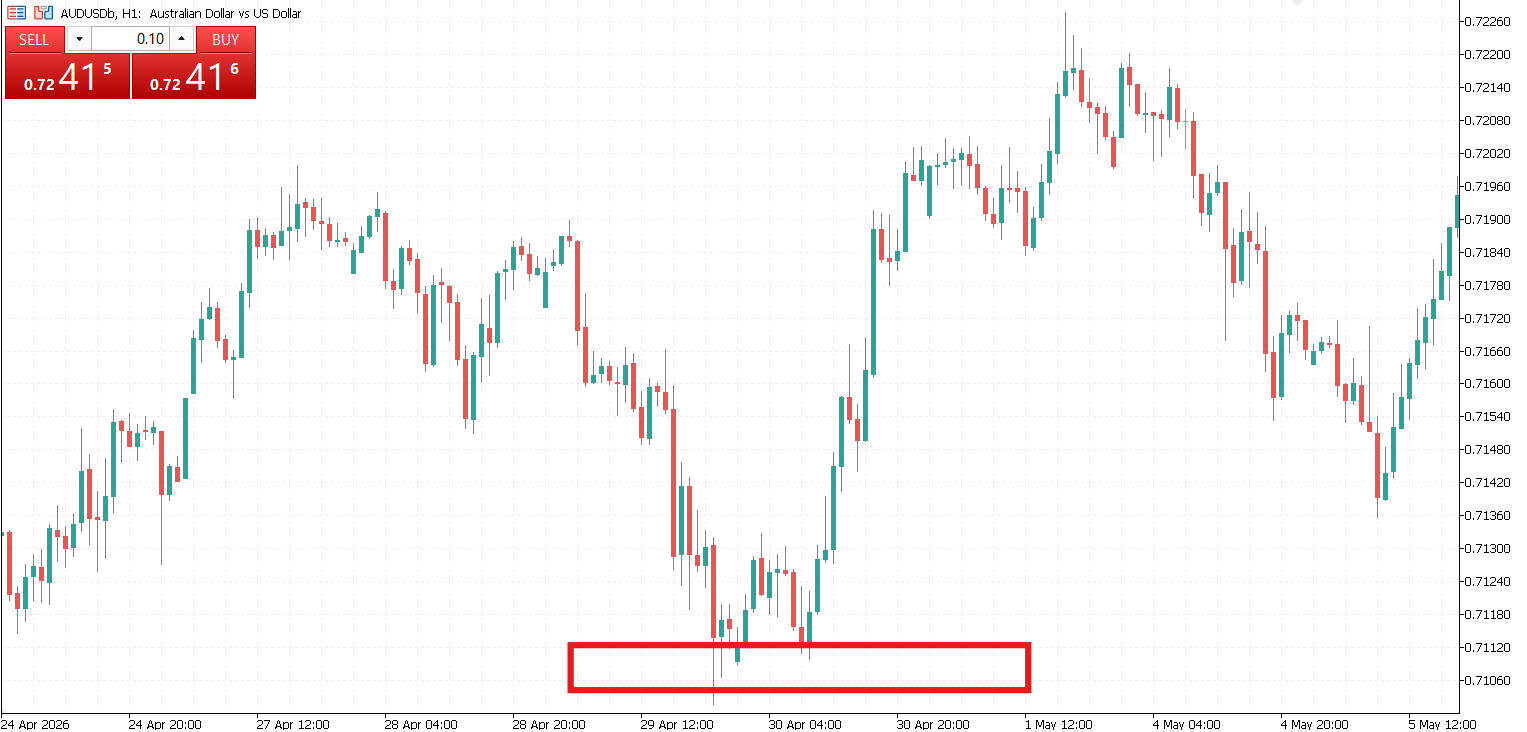
A demand zone is the opposite. It is an area where buying pressure exceeded selling pressure, leading to a strong upward move. It reflects a region where buyers previously stepped in aggressively.
In simple terms, supply zones are potential resistance areas, while demand zones are potential support areas. However, unlike traditional support and resistance lines, these zones are based on the concept of order flow and market imbalance rather than fixed levels.
How Supply and Demand Zones Are Formed
Supply and demand zones are created during moments of strong directional movement in the market. These movements typically occur when there is a significant imbalance between buyers and sellers.
A demand zone is formed when price consolidates for a short period and then moves sharply upward. This suggests that buyers absorbed all available selling pressure and pushed the price higher quickly. The base of this move becomes the demand zone.
A supply zone is formed when price consolidates and then drops sharply. This indicates that sellers overwhelmed buyers, leading to a fast decline. The top of this move becomes the supply zone.
The speed and strength of the move away from the zone are important. A strong impulsive move usually indicates a more significant zone, as it suggests institutional involvement or large market orders.
Types of Supply and Demand Zones
Not all zones are equal. Traders often classify them based on strength and structure.
- Fresh zones are areas that have not yet been retested by price. These are often considered the most reliable because the original imbalance may still exist.
- Tested zones are areas where price has already returned once or multiple times. Each retest can weaken the zone, as available orders may have already been filled.
- Rally-base-drop (RBD) structures form supply zones, where price rallies, consolidates, and then drops.
- Drop-base-rally (DBR) structures form demand zones, where price drops, consolidates, and then rallies.
Understanding these structures helps traders identify higher-probability areas on the chart.

How Traders Use Supply and Demand Zones
Traders use supply and demand zones as part of a broader price action strategy to identify potential trade opportunities. At demand zones, traders typically look for buying opportunities, expecting prices to bounce upward. At supply zones, they look for selling opportunities, expecting prices to decline.
However, traders rarely enter blindly. They often wait for confirmation, such as rejection candles, momentum shifts, or lower timeframe signals. Risk management is also crucial. Stop-loss orders are usually placed beyond the zone to protect against invalidation if the market breaks through.
Many traders also combine these zones with trend analysis. For example, buying only at demand zones in an uptrend increases the probability of success.

Why Supply and Demand Zones Work
The effectiveness of supply and demand zones is based on the idea that financial markets are driven by institutional order flow. Large banks, hedge funds, and institutions do not enter or exit positions at a single price. Instead, they accumulate or distribute positions across broader areas.
These zones often represent areas where:
- Large buy orders were previously filled (demand)
- Large sell orders were previously filled (supply)
- Market participants are likely to react again
Because of this, price often reacts when it revisits these areas, especially if unfilled orders remain.

Common Mistakes When Using Supply and Demand Zones
Although supply and demand zones are powerful, beginners often misuse them. One common mistake is drawing too many zones on the chart, which creates confusion and reduces clarity. Another mistake is treating zones as exact lines instead of broader areas.
Many traders also ignore market context. A demand zone in a strong downtrend may fail if overall selling pressure is still dominant. Another issue is entering trades without confirmation. While zones provide context, price action confirmation improves accuracy and reduces false entries.
Supply and demand zones offer a structured way to understand how price moves in financial markets. Instead of relying solely on indicators, traders can use these zones to identify areas where strong buying or selling pressure previously existed.
When used correctly, they help traders improve timing, increase probability of successful trades, and better understand market behavior. However, success depends on proper zone identification, confirmation techniques, and strict risk management.
Like any trading approach, mastery comes with experience, patience, and consistent practice in real market conditions.


