
In technical analysis, identifying potential market reversals is a key to capturing profitable trades. One of the most widely used tools for this purpose is the stochastic oscillator, developed by George Lane in the late 1950s. The stochastic oscillator is a momentum indicator that compares an asset’s closing price to its price range over a specific period. By highlighting overbought and oversold conditions, it helps traders anticipate market turning points before they fully unfold.
Stochastic reversal strategies aim to capitalize on these signals, often combining the oscillator with trend analysis, support and resistance, and candlestick patterns. When applied correctly, these methods can provide traders with high-probability entry points and effective risk management techniques.
In this article, we will explore the stochastic oscillator, how it works, practical reversal strategies, and tips to improve accuracy in different market conditions.

Understanding the Stochastic Oscillator
The stochastic oscillator consists of two lines: the %K line, which is the main line representing the current close relative to the price range over a set period, and the %D line, which is a smoothed moving average of %K used as a signal line. The oscillator moves between 0 and 100.
Values above 80 indicate the market may be overbought and could reverse lower, while values below 20 indicate the market may be oversold and could reverse higher. Like other momentum indicators, the stochastic oscillator is most effective when used alongside confirmation tools, since overbought or oversold conditions can persist in strong trends.
Basic Stochastic Reversal Strategies
Standard Overbought/Oversold Reversal
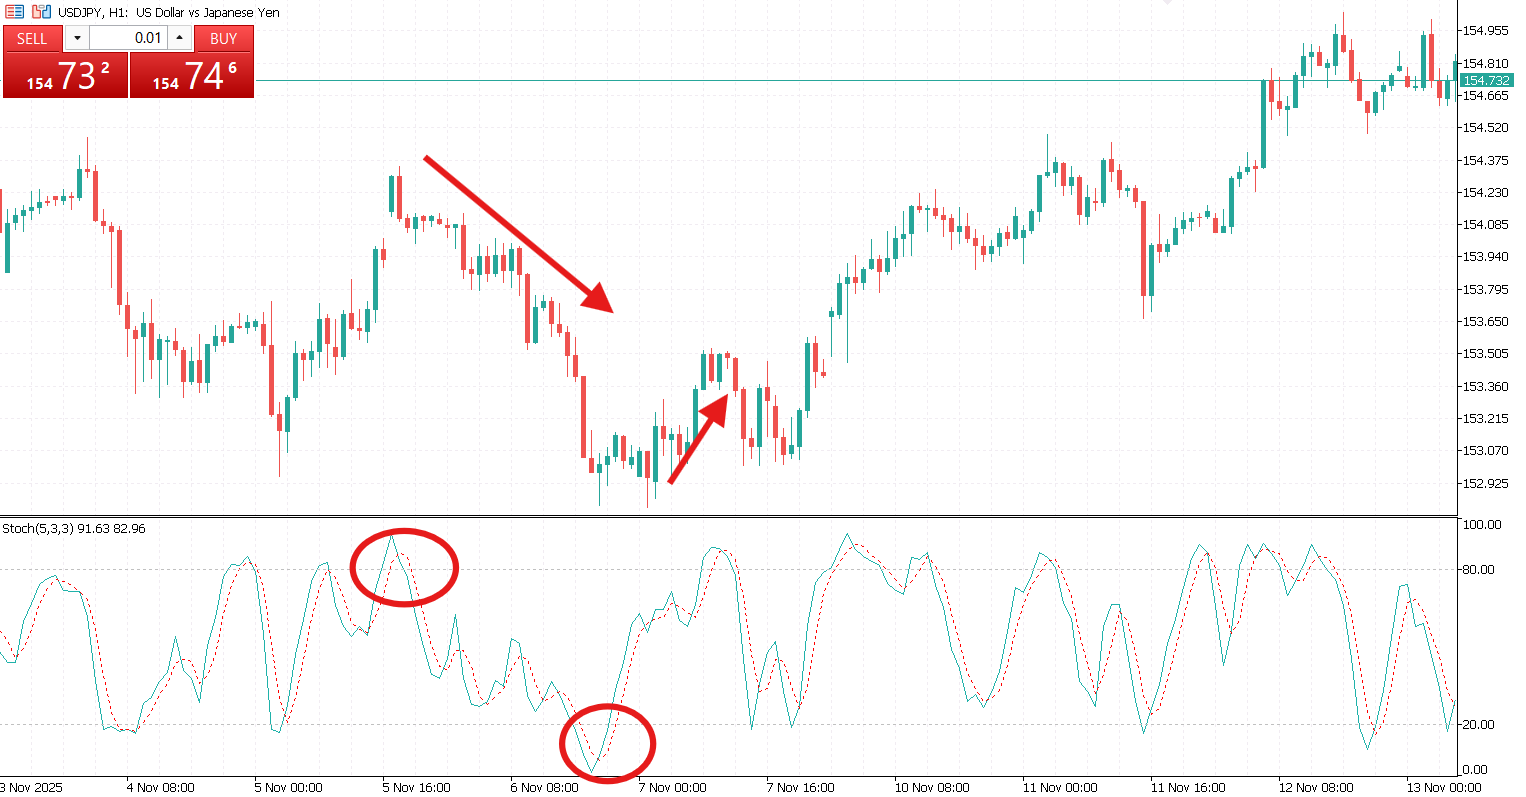
The standard overbought/oversold reversal strategy uses the typical threshold levels. A buy signal occurs when %K or %D drops below 20, indicating oversold conditions, and then rises back above it. A sell signal occurs when %K or %D rises above 80, indicating overbought conditions, and then falls below it.
This approach is easy to understand and widely recognized, but it can produce false signals in trending markets. For example, on a daily chart of a currency pair, if the %K line falls to 15 and then crosses back above 20, traders may look for a long entry, ideally confirmed by a bullish candlestick near support.
Stochastic Divergence
Stochastic divergence, similar to RSI divergence, can also be used. Bullish divergence occurs when the price forms a lower low while the stochastic forms a higher low, signaling weakening bearish momentum.
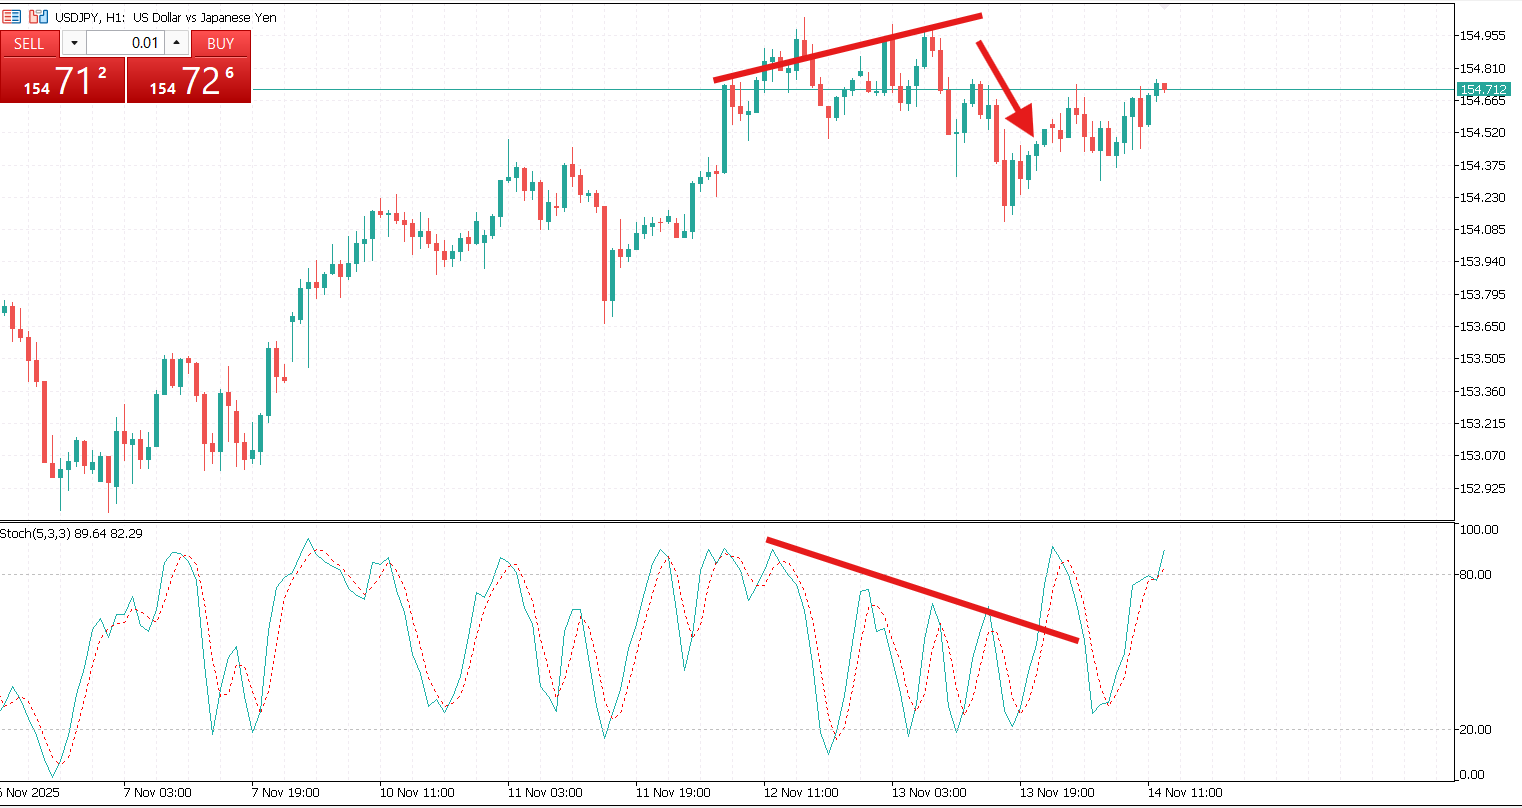
Bearish divergence occurs when the price forms a higher high while the stochastic forms a lower high, indicating weakening bullish momentum. Divergences can help anticipate reversals before they become obvious in price action.
%K/%D Crossovers
Another technique involves %K/%D crossovers. A bullish crossover happens when %K crosses above %D in oversold territory, signaling a potential upside reversal, while a bearish crossover occurs when %K crosses below %D in overbought territory, signaling a potential downside reversal. This method adds precision to entry timing, though in strong trends, repeated crossovers can cause whipsaw trades.
Stochastic Trend Filter
A stochastic trend filter can improve reliability in trending markets. The primary trend is first identified using moving averages or trendlines, and stochastic reversal signals are taken only in the direction of the trend during pullbacks.
For example, in an uptrend confirmed by a 50-period moving average, a drop of %K below 20 may indicate a temporary pullback rather than a trend reversal. Traders can then wait for %K to cross above %D before entering a long position aligned with the trend.

Risk Management for Stochastic Reversal Trading
Even the most effective stochastic setups require careful risk management. Stop-losses should be placed below recent swing lows for long trades or above recent swing highs for short trades. Position sizing is important, with risk typically limited to 1–2% of capital per trade to prevent large drawdowns.
Confirmation of stochastic signals with support and resistance levels, trend direction, or candlestick patterns can improve reliability. Traders should also be cautious in choppy, sideways markets, as stochastic signals can produce frequent false reversals when clear levels are lacking.
Common Mistakes to Avoid
Even though the stochastic oscillator is a powerful momentum tool, traders can make common mistakes that reduce its effectiveness. Being aware of these pitfalls can help improve trading outcomes:
- Ignoring the trend. Overbought or oversold readings can persist in strong trends, so signals against the trend may not lead to immediate reversals.
- Entering too early. Jumping in without confirmation can result in whipsaw trades; waiting for confirmation increases the likelihood of a successful entry.
- Neglecting stops. Reversals can extend further than expected, so always protect positions with properly placed stop-loss orders.
- Over-relying on stochastic alone. Using the stochastic in isolation can be risky; combining it with price action, support/resistance levels, or other indicators improves signal accuracy.

The stochastic oscillator is a versatile tool for identifying market reversals. By combining standard overbought/oversold levels, %K/%D crossovers, divergence, and trend filters, traders can anticipate potential turning points with greater confidence. Risk management and confirmation tools are essential to reduce false signals and protect capital.
Whether used in forex, stocks, or commodities, stochastic reversal strategies remain a valuable component of any trader’s toolkit. Mastering these techniques allows traders to enter high-probability trades at market pivots, increasing both efficiency and profitability.


 in Trading")