
Moving averages serve as one of the most widely used tools for smoothing price data and identifying market trends. Among them, the 50-period Simple Moving Average (SMA50) occupies a special place: it is long enough to filter market noise while still responsive enough to detect medium-term trend shifts.
Because of this balance, traders frequently rely on SMA50 breakout strategies to capture momentum, spot emerging trends, and time entries with greater confidence. This article explores the mechanics, variations, strengths, weaknesses, and practical tips for applying SMA50 breakout strategies effectively.
Understanding the SMA50
The SMA50 is calculated by taking the average closing price of an asset over the previous 50 periods. On a daily chart, this means 50 trading days; on a 1-hour chart, 50 hours; and so on. Because it smooths out short-term fluctuations, the SMA50 often acts as:
- Dynamic support or resistance
- A trend filter, distinguishing bullish from bearish environments
- A mean reference, showing when price may be extended or reverting
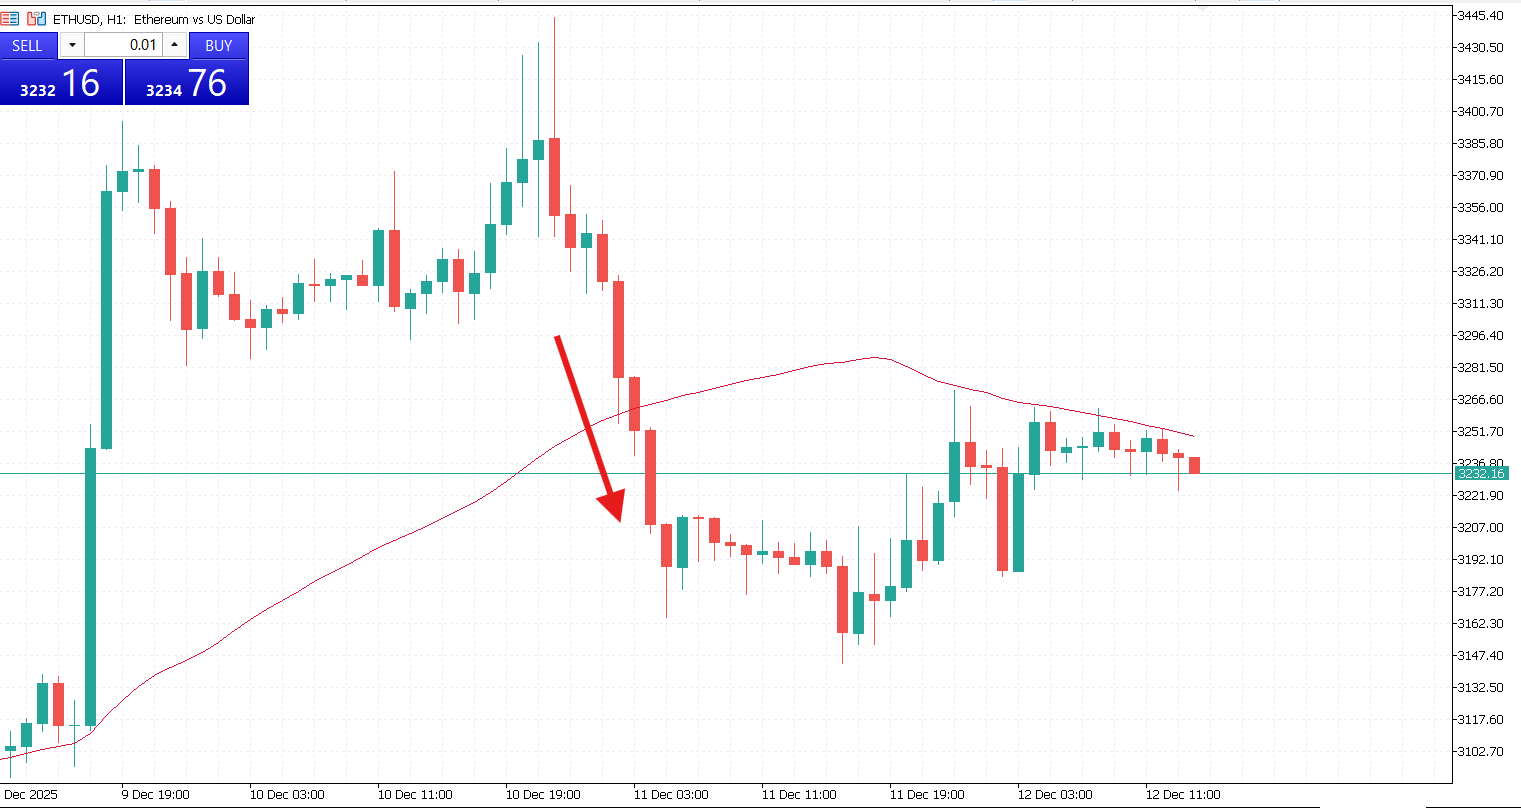
Breakouts through the SMA50 can therefore indicate an important shift. Price reclaiming the SMA50 after a prolonged downtrend may signal bottoming behavior, whereas losing the SMA50 in an uptrend can suggest exhaustion.

Basic SMA50 Breakout Strategy Structure
Most SMA50 breakout strategies follow the same general structure. They focus on identifying the conditions leading up to the move, confirming the breakout itself, and evaluating whether the momentum is likely to continue.
- The Setup. This stage forms when price approaches the SMA50. Traders look for candle compression near the moving average, reduced volatility ahead of a potential expansion, and long wicks rejecting the SMA50, which can signal an upcoming breakout attempt.
- The Breakout Trigger. A breakout is confirmed when price closes decisively above the SMA50 for long trades or below it for short trades. The breakout candle should be strong, ideally supported by higher volume, and it should not be immediately absorbed by opposing pressure.
- The Follow-Through. After the breakout, traders look for continued price movement in the breakout direction. A pullback to retest the SMA50 can offer a secondary entry, and trend indicators such as RSI, MACD, or ADX help confirm momentum.
Types of SMA50 Breakout Strategies
Direct Break-and-Go Strategy
This approach involves entering the market as soon as price closes above or below the SMA50. A short entry occurs when price closes below the SMA50 while volume expands, with a stop-loss placed just above the breakout candle or a recent swing.
Its main advantage is the ability to capture strong momentum early, but it also carries a higher chance of false breakouts and demands strict stop-loss discipline.
Breakout and Retest Strategy
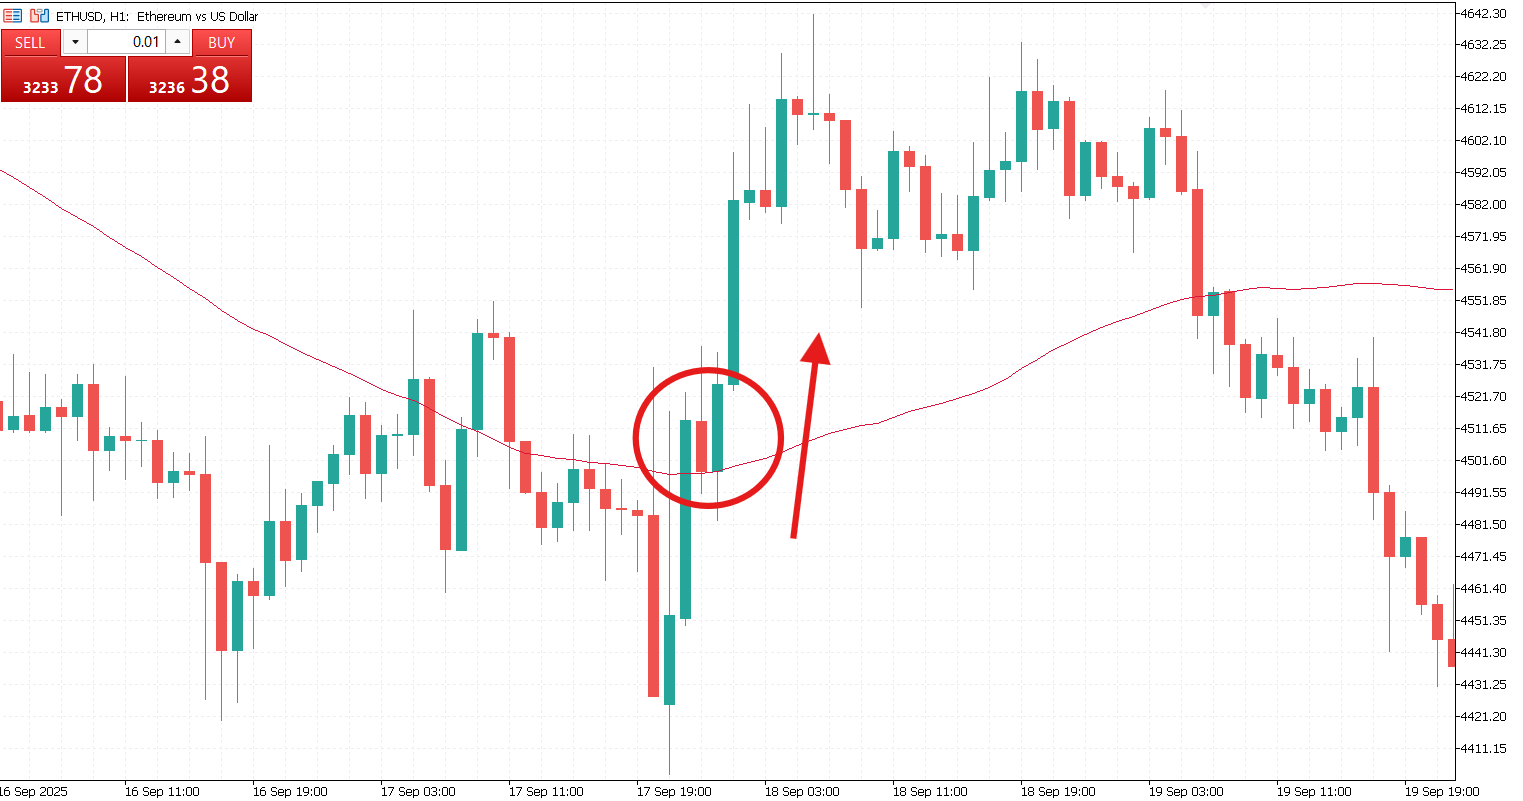
Instead of entering at the moment of the breakout, traders wait for price to pull back and test the SMA50, confirming it as new support or resistance. This works because breakouts often retrace due to profit-taking, liquidity grabs, or algorithmic flows, and a successful retest signals genuine acceptance above or below the SMA50.
Entries are triggered by a clean retest that forms a bullish or bearish reversal candle, supported by RSI or MACD trending in the breakout direction and renewed volume strength. The method is more reliable and offers stronger risk–reward potential, though it sometimes misses fast moves that never retest.

SMA50 and Trendline Break Combination
This technique requires both a trendline break and an SMA50 break to confirm a shift in market direction. For example, in a downtrend where price forms lower highs along a descending trendline, a valid signal appears when price breaks above both the trendline and the SMA50, followed by a confirming candle close. This dual confirmation helps filter out false moves and increases confidence in the breakout.
SMA50 with Multi-Timeframe Analysis
Here, the SMA50 on a higher timeframe provides the dominant trend bias, while a lower timeframe offers the precise breakout entry. For instance, if the daily chart shows the SMA50 rising, the macro trend is bullish, and a breakout above the SMA50 on a one-hour chart becomes a higher-probability trigger. Aligning trends across timeframes improves the likelihood of catching sustained moves.

Avoiding Common False Breakouts
False breakouts happen when price briefly crosses the SMA50 but quickly reverses. To reduce the likelihood of being caught in these traps, traders should focus on entries where the candle closes firmly beyond the SMA50, as wicks alone are not sufficient and a close demonstrates real market conviction.
Volume should also be considered, since low-volume breakouts are more prone to failure. Market volatility plays a role too; during sideways or choppy conditions, the SMA50 is less reliable as support or resistance, whereas breakouts tend to be more dependable in established trends or after long consolidation periods. Additionally, nearby support or resistance levels should be taken into account, because a breakout that runs straight into overhead supply or demand may struggle to continue.

Stop-Loss and Take-Profit Strategies
Stop-losses are commonly placed just below or above the SMA50, beyond recent swing highs or lows, or at a multiple of the ATR, such as 1.5 times the ATR, to account for normal market fluctuations.
For taking profits, traders often aim for an initial target based on a 1:3 risk–reward ratio, take partial profits at the first significant liquidity zone, or use a trailing stop guided by the SMA20 or SMA50. In trending markets, letting winners run can also maximize gains while still managing risk.
The SMA50 breakout strategy is a versatile and time-tested method for identifying directional bias, timing entries, and capitalizing on emerging trends. Its power lies in its simplicity: a single moving average creates a clear line between bullish and bearish territory. Yet successful use of SMA50 breakouts requires more than just reacting to price crossing a line. Traders must evaluate context, confirm momentum, manage risk, and understand prevailing market conditions.
Whether you prefer direct breakouts, retests, multi-timeframe confluence, or indicator confirmations, the SMA50 can serve as a reliable anchor for a structured trading plan. With disciplined execution and continuous refinement, SMA50 breakout strategies can become a powerful component of your trading toolkit, helping you navigate markets with greater clarity and confidence.


