
Bollinger Bands (BB) are a technical analysis indicator designed to help traders gauge volatility, identify trends, and spot potential reversals. While many traders use them in a basic way, mastering their subtle nuances can transform a trading approach from good to exceptional. In this article, we’ll uncover the secrets of trading with Bollinger Bands, sharing advanced techniques, psychological insights, and practical tips to help you unlock their full potential.
Secret #1: Volatility is Your Friend
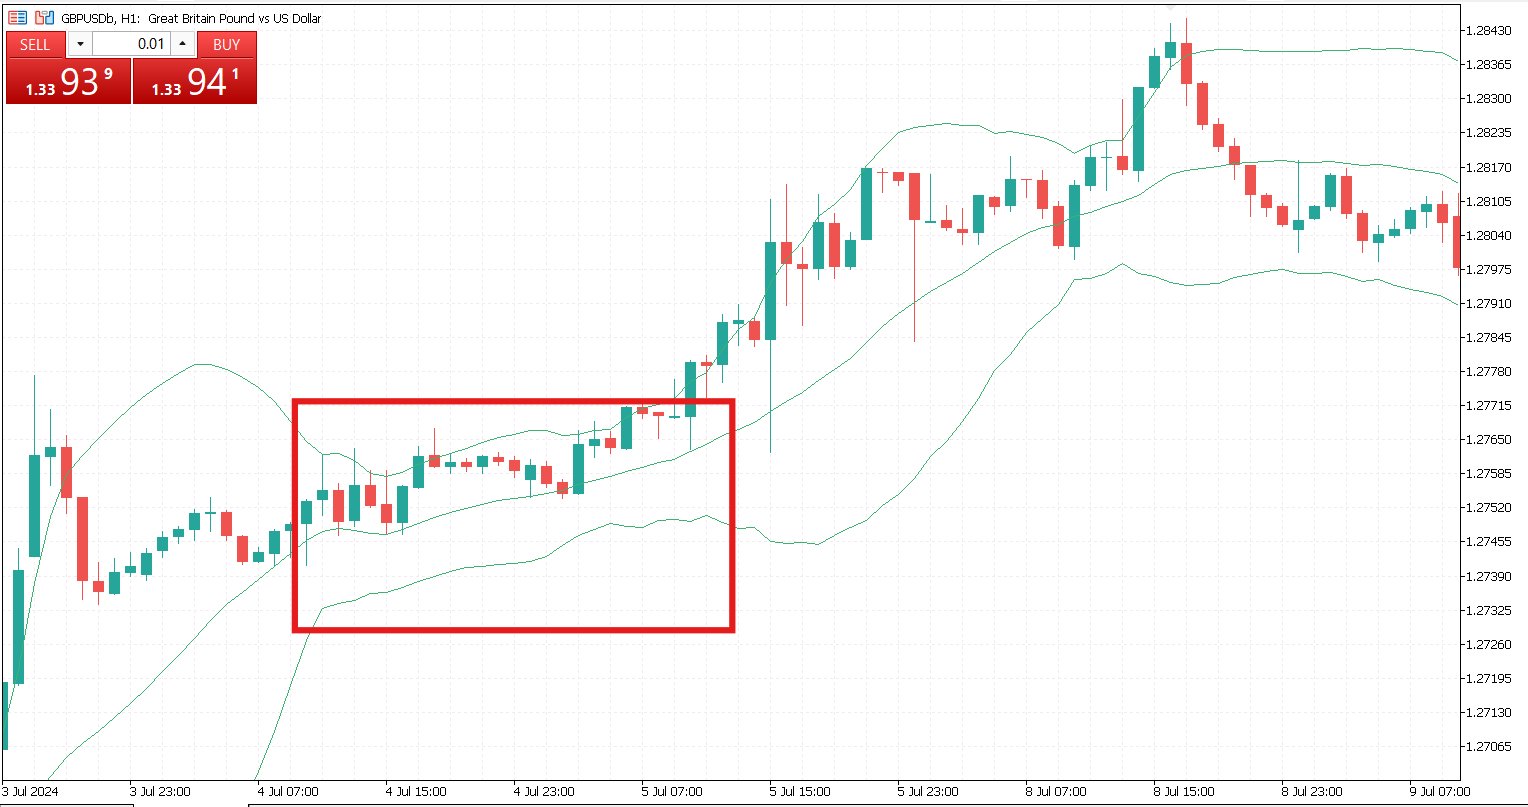
Many traders focus solely on price touching the upper or lower bands, often assuming it signals overbought or oversold conditions. While this can be true, it’s more subtle. The real secret lies in observing how the bands behave. Narrowing bands, known as a “squeeze”, signal low volatility and often precede explosive price moves. Traders who anticipate breakouts during squeezes often gain early entry into trends before the wider market reacts.
Conversely, during high volatility, when the bands expand dramatically, prices may overextend. Understanding volatility’s context helps you avoid false signals and ride trends more confidently.
Secret #2: Combining Bollinger Bands with Trend Analysis
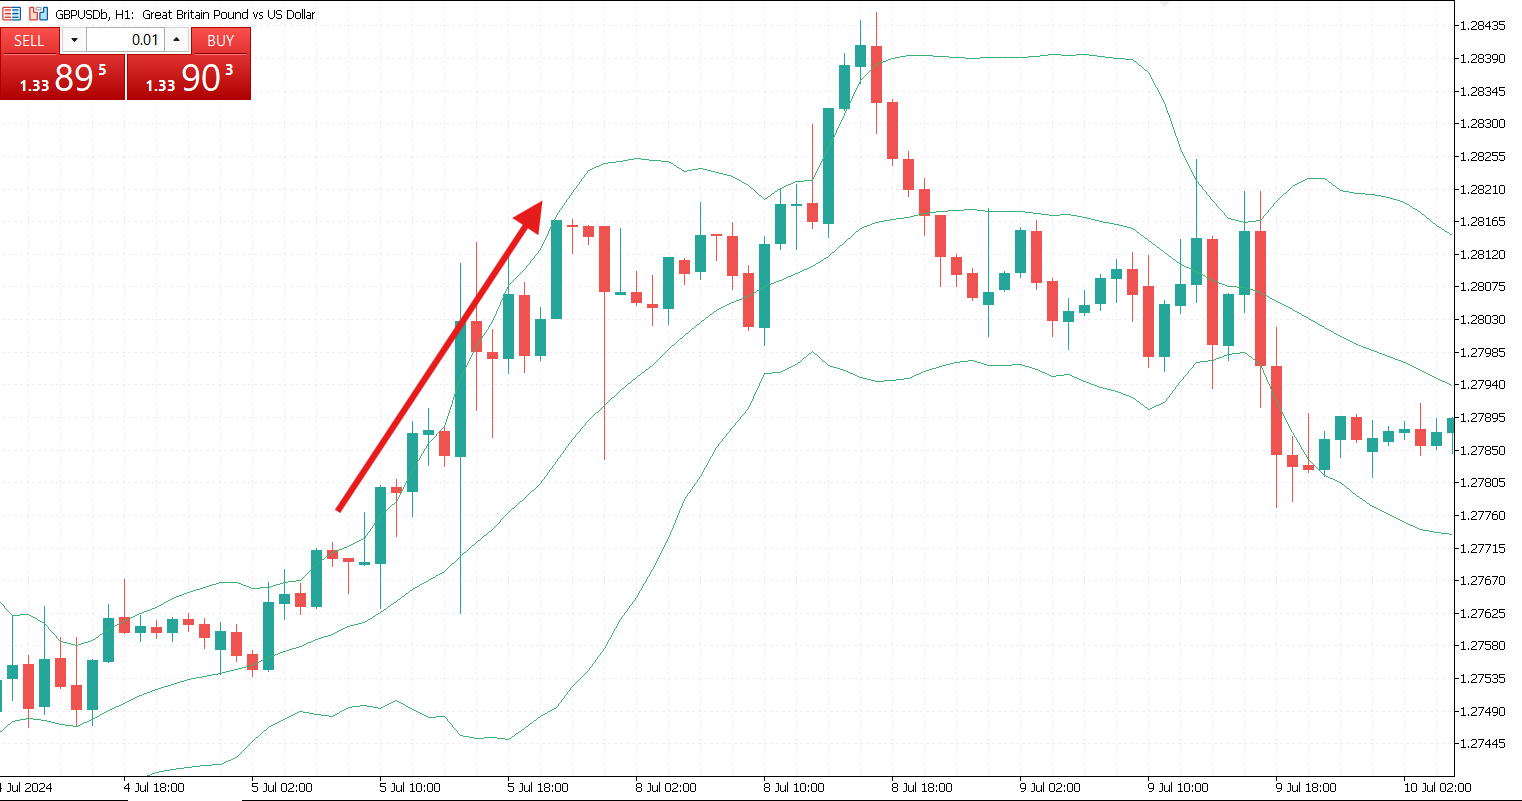
Bollinger Bands work better when paired with trend analysis. For example, in an uptrend, prices may “ride the band,” or stay just below it, repeatedly touching or hovering near the upper band without reversing. Selling at the upper band in such scenarios can be premature and costly, as the one-sided movement may continue. Instead, traders can use the bands to identify healthy pullbacks within the trend, entering positions near the middle or lower band in an uptrend, and vice versa in a downtrend.
Advanced traders also use moving average crossovers or trendlines in conjunction with Bollinger Bands to confirm entry and exit points. This combined approach minimizes false signals and increases the probability of capturing sustained moves.
Secret #3: The Power of Divergence
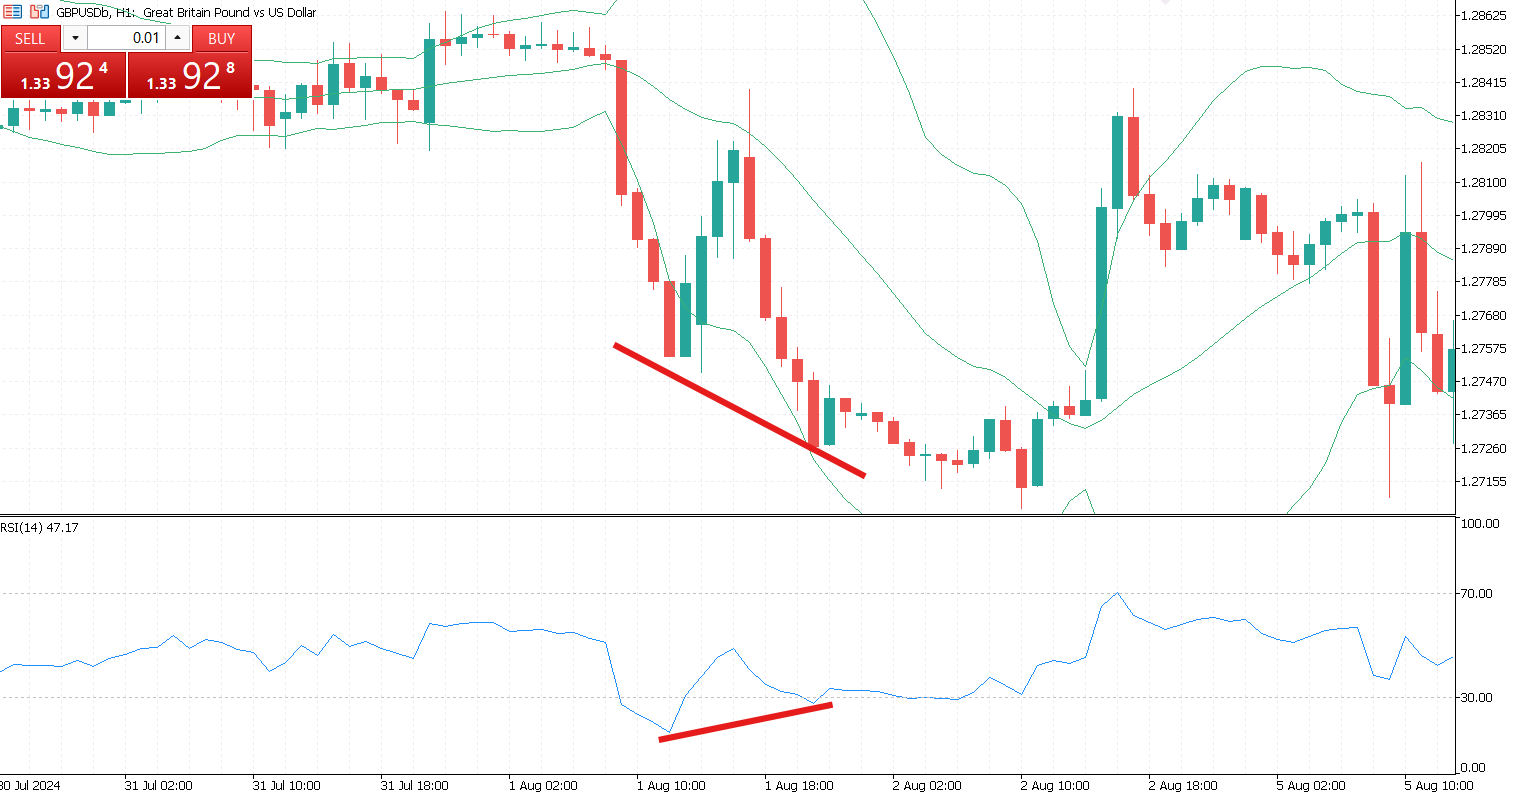
Divergence between price and indicators can reveal hidden opportunities. While Bollinger Bands do not directly measure momentum, combining them with indicators like RSI (Relative Strength Index) or MACD (Moving Average Convergence Divergence) can uncover subtle divergences.
For instance, if prices touch the lower band but RSI shows a bullish divergence, it may signal an impending reversal. This allows traders to act before the market’s conventional patterns become obvious.
Secret #4: Multi-Timeframe Analysis
Bollinger Bands are not limited to a single timeframe. In fact, analyzing bands across multiple timeframes can offer powerful insights. A squeeze on a daily chart might signal a significant breakout, while an intraday chart can provide precise entry points. This layered approach allows traders to align broader market trends with short-term opportunities, creating high-probability trade setups.
Secret #5: The Role of Psychology
Bollinger Bands are as much a psychological tool as they are a mathematical one. The bands visualize market sentiment, fear, and greed. A sudden move outside the bands can trigger panic selling or buying, often leading to short-term reversals. Understanding the emotional context behind these moves allows traders to act rationally rather than reactively, giving them a psychological edge over less disciplined participants.
Secret #6: Customizing the Bands
While the default setting of 20 periods and 2 standard deviations works well for many markets and strategies, advanced traders often tweak these parameters. Shorter periods with narrower deviations capture fast-moving, volatile markets, while longer periods with wider deviations help smooth out noise in slower markets. Customization allows traders to adapt Bollinger Bands to their specific strategy, timeframe, and risk tolerance.
Practical Tips for Traders to Master Bollinger Bands
- Avoid trading BB alone. Use complementary indicators and trend analysis to confirm signals.
- Check the current market context. Bands are more meaningful when analyzed with volatility, trend strength, and market cycles.
- Stay patient. The most profitable setups often appear during squeezes or after confirmed trend pullbacks.
- Record your trades in a trading journal. Documenting band behaviors, setups, and outcomes helps refine intuition over time.
- Stick to your risk management strategies. Even with Bollinger Bands, no signal is perfect. Proper stop losses and position sizing are essential.

Bollinger Bands are deceptively simple on the surface, yet mastering them can significantly enhance trading performance. The real “secrets” lie not in blindly buying or selling when the price reaches the bands, but in understanding volatility, trends, psychology, and market context. By observing squeezes, divergences, and multi-timeframe patterns, traders can unlock powerful insights and improve their probability of success.
Ultimately, Bollinger Bands are not just a tool. They are a lens that helps traders grasp the market’s rhythm and trade with confidence and precision. By mastering these techniques, what once seemed like random market chaos transforms into a landscape of opportunities.


