
Price action trading is the study of historical price movements to forecast future market behavior, a discipline that strips away the noise and focuses on the purest form of market data: the price chart. Despite its simplicity, the secrets of price action are subtle, requiring patience, observation, and a deep understanding of market psychology.
Understanding the Core Concept
Price action is essentially the story told by the market. Every candlestick, bar, or tick represents a moment of buying and selling, reflecting the collective psychology of all market participants. Unlike indicator-based trading, price action relies on raw market movement, not on derived metrics. This makes it inherently adaptive, unlike lagging indicators, price action reacts in real time to changing conditions.
Candlestick Patterns
Candlesticks are the basic alphabet of price action, and each candle tells a story. A bullish pin bar shows rejection of lower prices, meaning buyers are stepping in. A bearish engulfing pattern suggests strong selling pressure and often signals a reversal. An inside bar shows consolidation and uncertainty, usually appearing before a breakout.
Mastering candlestick patterns isn’t about memorizing countless shapes, it’s about understanding context. A pin bar at a strong support level is much more meaningful than the same pin bar appearing in the middle of a range.
Support and Resistance: The Market’s Memory
Support and resistance levels are historical footprints of supply and demand, where traders previously bought or sold. These levels act as magnets for future price reactions:
- Support. A price zone where buying interest prevents further decline.
- Resistance. A price zone where selling interest caps upward movement.
Identifying these zones isn’t about drawing perfect horizontal lines. Traders often use zones rather than exact points, reflecting the natural variability of human behavior and order placement.
Trend Analysis: Riding the Market Flow
Markets move in one of three ways: upward, downward, or sideways. The core of price action lies in recognizing which trend is dominant and aligning your trades with it rather than fighting against it. An uptrend is marked by price forming higher highs and higher lows, while a downtrend shows the opposite with lower highs and lower lows.
When price moves sideways, it signals indecision and a lack of clear direction. Tools like trendlines, channels, and swing points can help you visualize these movements, but the real understanding comes from watching how price behaves at important levels within the trend. When price pulls back to a trendline and the price action supports the continuation of the move, it often indicates a strong continuation of the underlying trend.
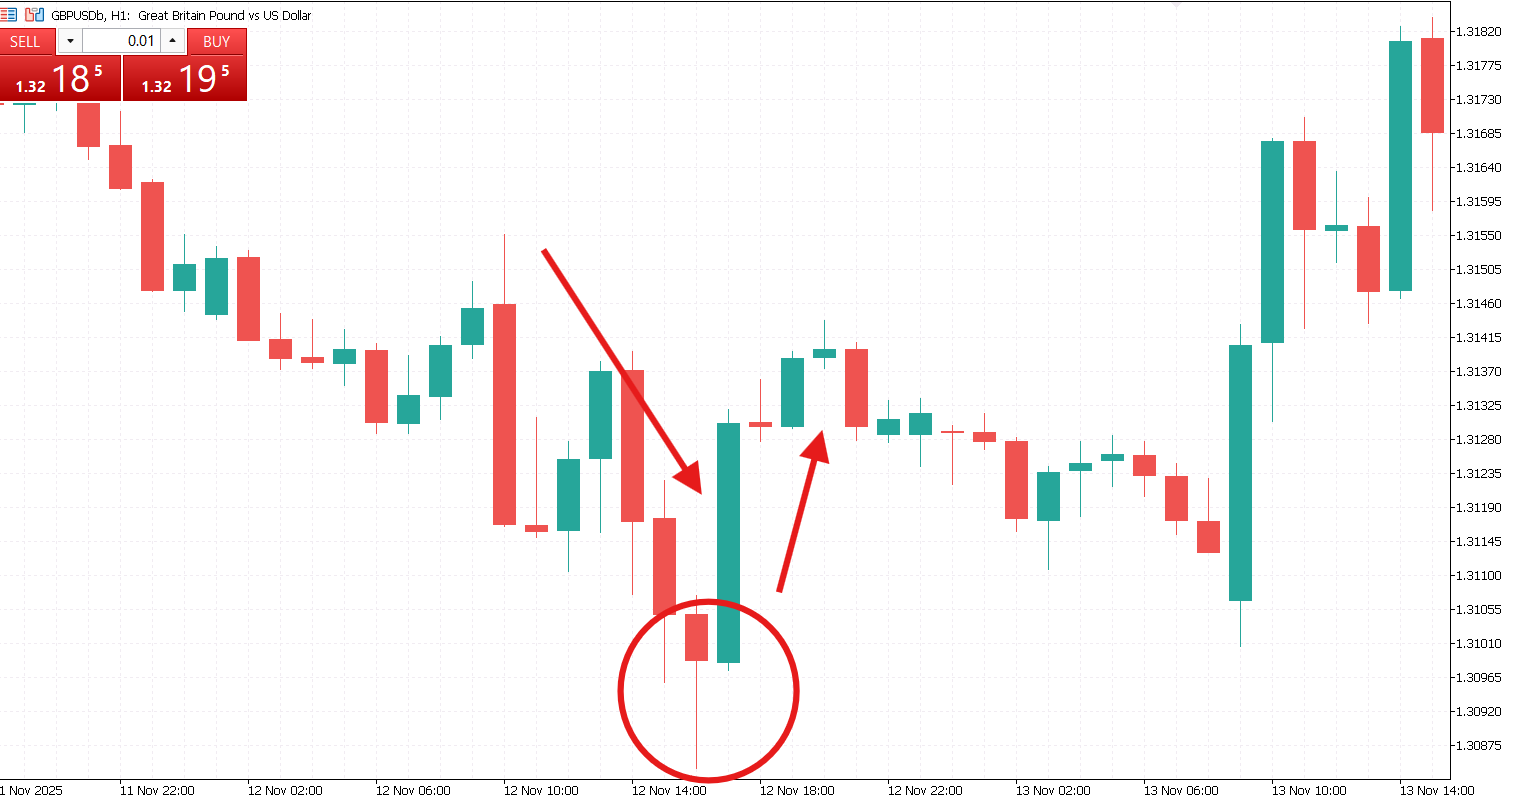
Breakouts and False Breakouts
Breakouts are moments when price escapes from consolidation zones. The key is to distinguish true breakouts from false breakouts, a skill that separates novice traders from professionals.
- True breakout. Often accompanied by strong momentum and volume; price doesn’t return immediately.
- False breakout. Price quickly reverses, trapping traders. Look for confirmation from candlestick patterns and nearby support/resistance.
A secret many traders overlook: trading the retest of a broken level often yields higher-probability setups than entering immediately on the breakout.

Risk Management: Protecting the Edge
Even the most refined price action approach becomes ineffective without solid risk management behind it. Successful traders understand that managing risk is not an optional add-on but the foundation that supports every decision they make.
This begins with controlling position size so that only a small portion of total capital is exposed on any single trade, which helps prevent a single loss from causing serious damage. It also involves placing stop-loss orders in logical areas, typically beyond recent swing points or outside important levels, so that the market has room to move naturally without taking the trader out prematurely.
Equally important is maintaining a favorable balance between potential reward and potential loss. Traders often look for situations where the possible gain meaningfully outweighs the risk they are taking, because this allows profitable outcomes even when not every trade works out. In the end, price action may guide entries and exits, but it is discipline, patience, and respect for risk that keep traders consistent and allow them to stay in the game over the long term.
Price action is deceptively simple but profoundly effective. By focusing on what price tells you, ignoring unnecessary noise, and respecting market psychology, traders gain a powerful, adaptable edge. The secrets lie not in complicated formulas but in attentive observation, disciplined execution, and an understanding of human behavior. Those who master these elements find that markets communicate clearly, if only one listens.
In the end, price action trading is as much an art as a science. The charts are not just numbers and lines, they are living stories of human emotion, fear, and greed. The better you learn to read them, the more consistent and confident your trading becomes.


