
Technical indicators are essential tools in trading, helping traders interpret price movements and transform raw market data into actionable insights. In this article, you’ll learn the key differences between two of the most widely used indicators: RSI and MACD, and how each can help guide your trading decisions.
What Is RSI?
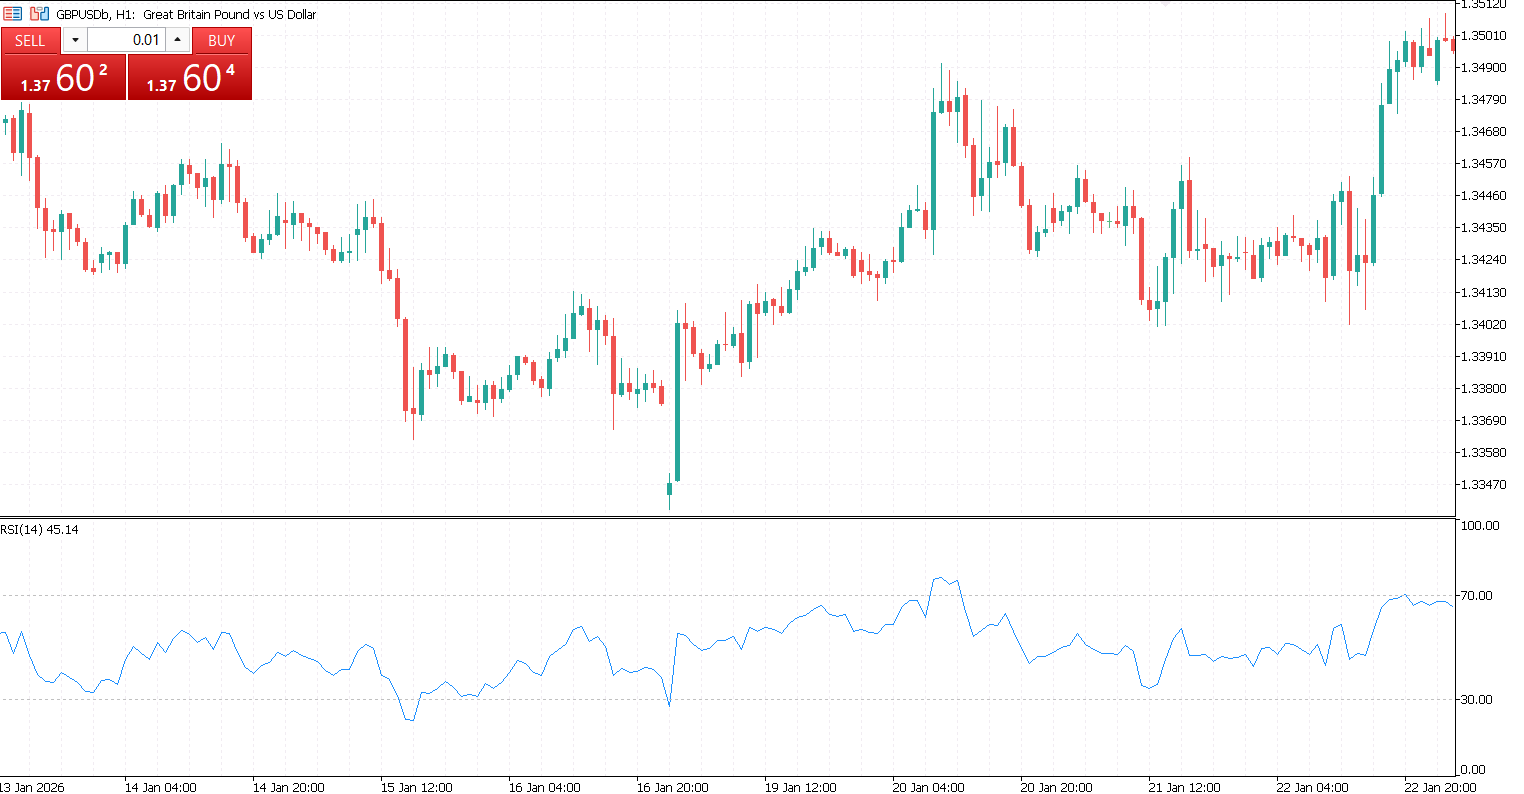
The Relative Strength Index (RSI) is a momentum oscillator used in technical analysis to measure the speed and magnitude of recent price movements. Its primary purpose is to help traders assess whether an asset is gaining or losing momentum and to identify potential reversal points. RSI values move within a fixed range from 0 to 100, making it easy to interpret and compare across different markets and timeframes.
RSI works by comparing average gains to average losses over a specified period, most commonly 14 periods. Traders typically focus on two key levels: 70, which indicates overbought conditions, and 30, which signals oversold conditions. When RSI rises, it reflects increasing bullish momentum; when it falls, it shows growing bearish momentum. The slope and direction of the RSI line also provide insight into how strong or weak current price momentum is.
What Is MACD?
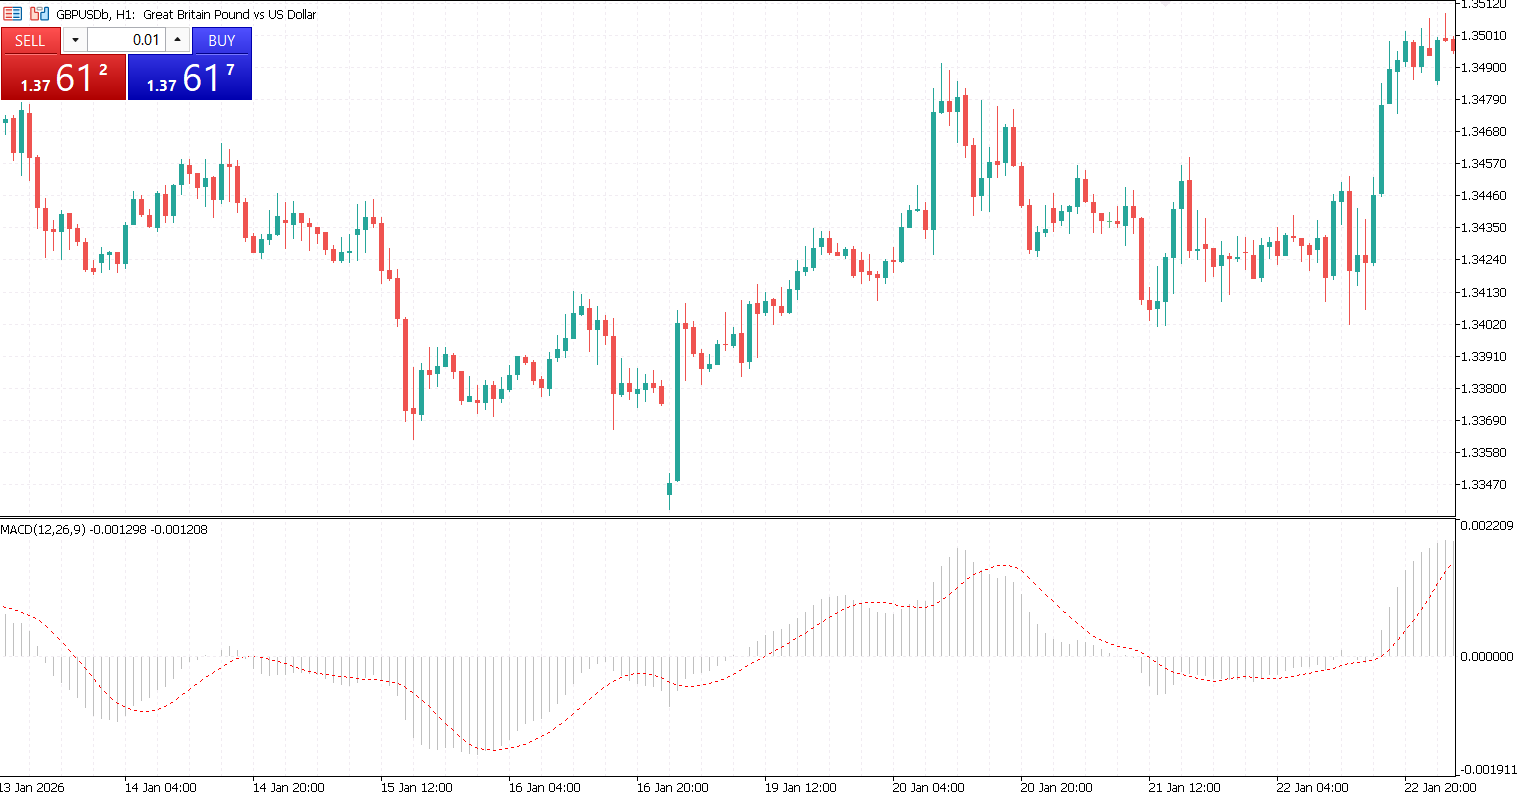
The Moving Average Convergence Divergence (MACD) is a trend-following momentum indicator that helps traders identify changes in the strength, direction, and duration of a price movement. It is composed of three main elements: the MACD line (the difference between two exponential moving averages), the signal line (a moving average of the MACD line), and the histogram (the visual difference between the MACD line and the signal line). Together, these components allow traders to spot trend shifts and momentum changes more clearly.
MACD works by analyzing the convergence and divergence of moving averages. When the shorter-term moving average moves closer to or crosses above the longer-term moving average, it indicates a potential bullish momentum shift, and vice versa for bearish momentum. Traders often watch signal line crossovers as confirmation of trend changes, with the MACD line crossing above the signal line suggesting a buy signal, and crossing below indicating a sell signal.

RSI vs MACD: Key Differences
RSI and MACD are both popular momentum indicators, but they serve different purposes and behave differently in the market. RSI is a momentum oscillator, designed to measure the speed and strength of price movements within a fixed range (0–100). MACD, on the other hand, is a trend-following indicator, which focuses on the relationship between moving averages to identify trend direction and momentum shifts.
In terms of speed, RSI reacts faster to price changes, making it more useful for spotting overbought or oversold conditions and short-term reversals. MACD is slower because it relies on moving averages, which smooth out price action, making it better for confirming longer-term trends. Market conditions also influence which indicator works best: RSI performs well in ranging markets, while MACD excels in trending markets. Finally, RSI is relatively simple and intuitive, whereas MACD can be slightly more complex, requiring interpretation of multiple components like the MACD line, signal line, and histogram.
When to Use RSI
RSI is most effective in range-bound or sideways markets, where prices oscillate between support and resistance levels. In these conditions, RSI can help traders identify overbought and oversold levels, signaling potential buying or selling opportunities.
RSI is also ideal for short-term trading and scalping, as its faster response to price movements allows traders to react quickly to momentum shifts. Additionally, RSI is useful for spotting potential reversals through divergence, where the indicator moves opposite to price, hinting that the current trend may be weakening.

When to Use MACD
MACD is best suited for strong trending markets, where its moving-average-based calculations can accurately highlight the direction and strength of a trend. It helps traders avoid false signals that can occur in choppy or sideways markets.
This indicator is particularly useful for swing trading and position trading, as it focuses on capturing larger price moves over days or weeks rather than quick, short-term fluctuations. MACD also excels at trend confirmation and assessing momentum strength, helping traders determine whether a trend is likely to continue or weaken before making entry or exit decisions.

RSI vs MACD: Which Is Better?
There is no universal “better” indicator and choosing between them depends on your trading style and the market conditions. RSI is often favored in range-bound markets and for traders seeking quick signals, while MACD is better for trending markets and for confirming the strength of longer-term trends.
For beginners, RSI can be easier to understand and apply due to its simple overbought/oversold signals. Advanced traders may prefer MACD for its multiple components and the ability to combine trend and momentum analysis.
It’s important to remember that neither indicator is a guarantee of success. They are tools to help guide decisions. The best approach is to test and practice using demo accounts or backtesting strategies to understand how each indicator behaves in different scenarios. Combining RSI and MACD thoughtfully can enhance trading decisions, but experience and risk management remain essential.


