
As a trader, having a range of strategies is crucial for navigating the markets effectively. One valuable tool in a trader’s toolkit is the Relative Strength Index (RSI) trading strategy. This article explores using the RSI to enhance trading decisions, potentially boosting profitability and managing risk.
What Is the RSI?
The Relative Strength Index (RSI) is a widely used momentum oscillator created by J. Welles Wilder Jr. and detailed in his 1978 book, New Concepts in Technical Trading Systems. The RSI measures the speed and change of price movements over a specific period, offering insights into a security’s momentum.
Typically displayed as a line graph fluctuating between 0 and 100, the RSI visually represents price strength. By analyzing these oscillations, traders can identify overbought or oversold conditions, potential market trends, and reversals.
Key RSI Trading Strategies
Overbought and Oversold Levels
One everyday use of the RSI is to identify overbought and oversold conditions, which may signal potential trade opportunities:
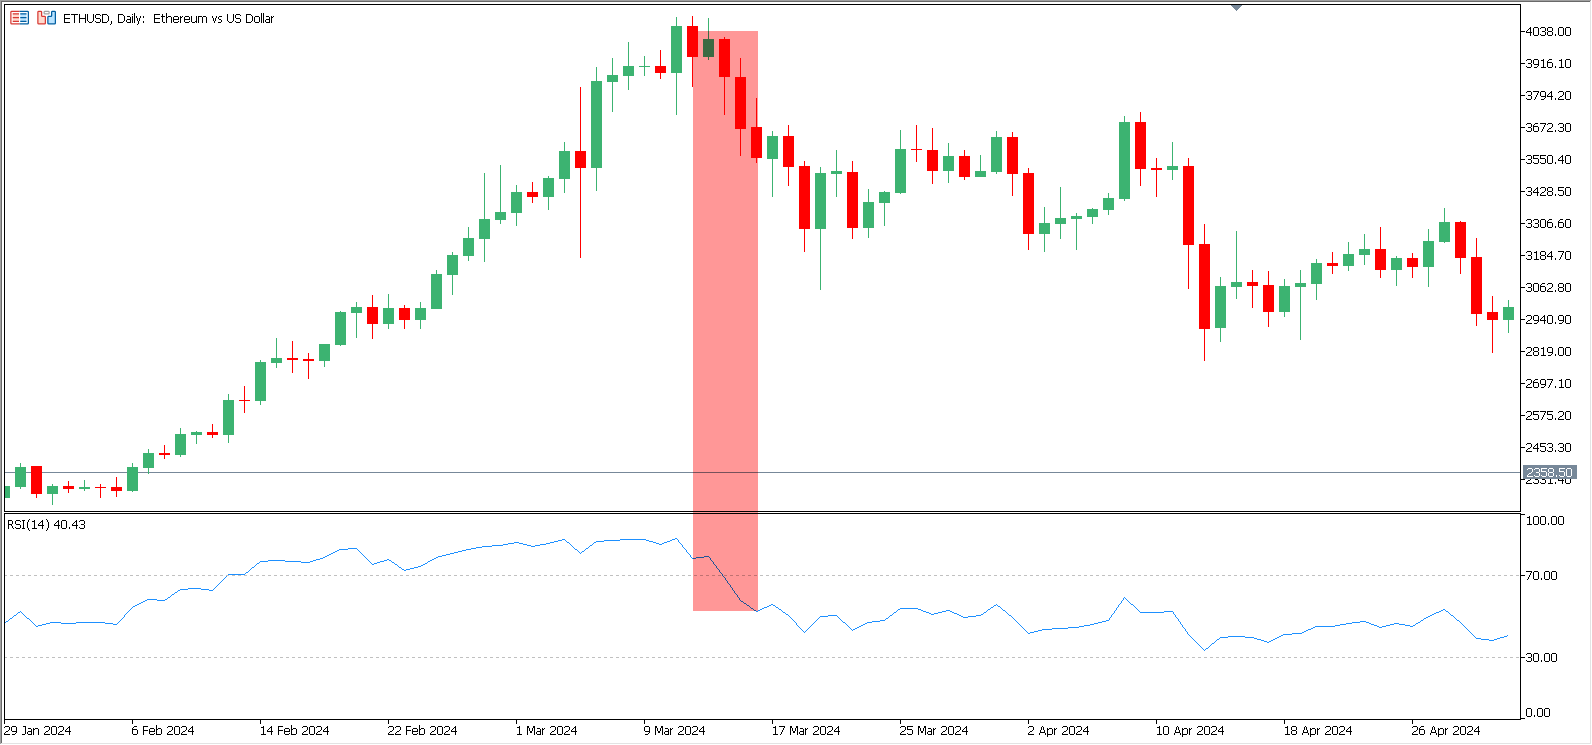
- Overbought Conditions. An RSI reading above 70 (or higher, depending on the strategy) suggests an asset may be overbought, meaning its price has risen excessively and could soon be corrected or reversed. Traders might consider selling or refraining from buying until the situation stabilizes. Additional confirmation from other indicators, such as bearish candlestick patterns or trendline breaks, can strengthen this signal.
- Oversold Conditions. An RSI reading below 30 (or lower) indicates that an asset may be oversold, meaning its price has dropped too quickly and could rebound. Traders might look for buying opportunities or avoid selling. Confirmation from bullish candlestick patterns or trendline support can validate this signal.
While these levels are helpful, it’s important to note that markets can remain overbought or oversold for extended periods, making this strategy less reliable.
RSI Divergence
RSI divergence occurs when the price movement of an asset diverges from the RSI’s movement, signaling potential trend reversals. There are four main types:
- Bullish Divergence. Occurs when the price makes lower lows while the RSI makes higher lows. It suggests a weakening downward momentum and a possible upward reversal.
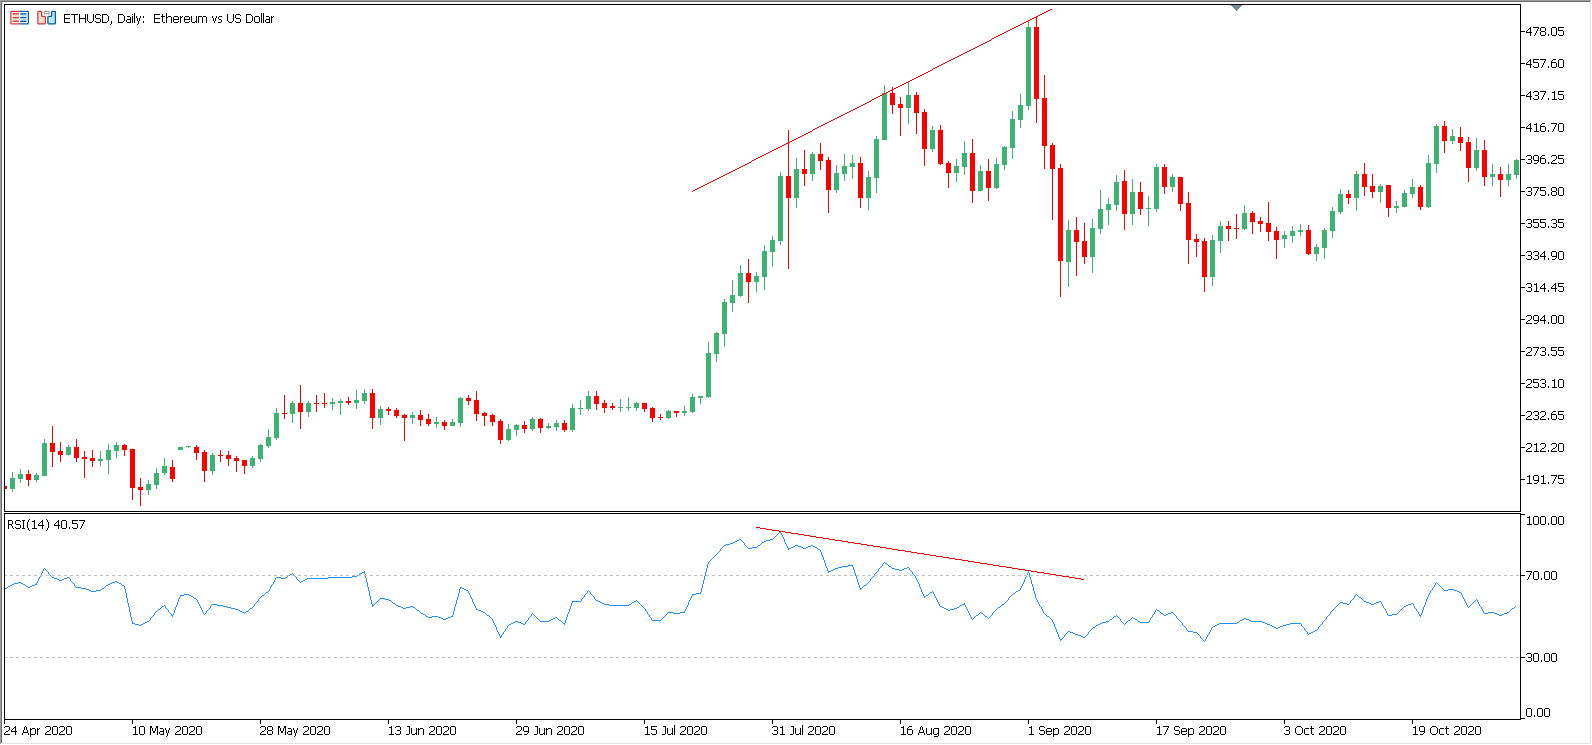
- Bearish Divergence. Occurs when the price makes higher highs while the RSI makes lower highs. It indicates weakening upward momentum and a potential downward reversal.
- Hidden Bullish Divergence. This is seen when the price makes higher lows, but the RSI makes lower lows, suggesting that the underlying bullish trend remains strong despite a short-term price dip.
- Hidden Bearish Divergence. This occurs when the price decreases, but the RSI makes higher highs, indicating that the bearish trend remains intact despite a temporary price bounce.
Divergence signals can be further validated with additional tools such as chart patterns, volume analysis, or fundamental insights to minimize the risk of false signals.
RSI Swing Rejections
The RSI swing rejection strategy focuses on observing the RSI’s reaction at swing highs and lows:
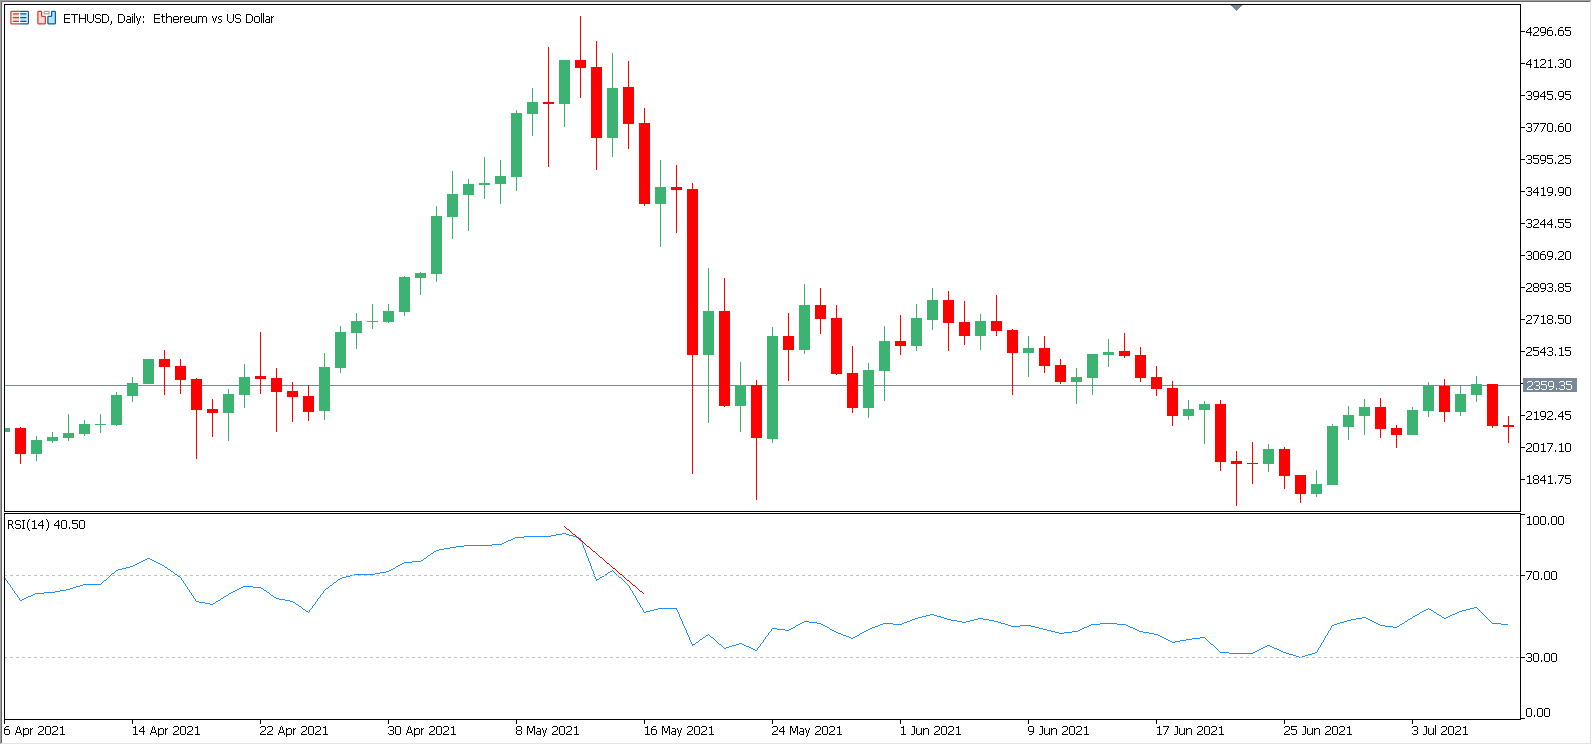
- Swing High. When the RSI reaches a high and begins to decline, a swing high rejection suggests upward momentum may wane. Traders might look for opportunities to sell or short.
- Swing Low. When the RSI reaches a low and starts to rise, a swing low rejection indicates potential strengthening of the upward momentum. Traders might consider buying or going long.
These swing rejections can signal changes in market momentum, allowing traders to capitalize on potential reversals. However, to confirm the signals, this strategy should be used in conjunction with other indicators.
RSI Pros and Cons
The Relative Strength Index (RSI) is a popular tool in technical analysis, but like any indicator, it has its strengths and weaknesses. Here’s a clear breakdown of the pros and cons of using RSI in trading:
Pros
- Easy identification of overbought and oversold conditions. The RSI is straightforward and efficient for spotting overbought and oversold conditions in the market. This can quickly signal potential trade opportunities.
- Versatile across time frames. Whether engaging in intraday or long-term trading, the RSI can be applied to any time frame, making it a flexible tool for various trading strategies.
- Compatible with other indicators. The RSI works well with other technical indicators, such as moving averages and trendlines. Combining RSI with these tools can enhance signal accuracy and decision-making.
- It helps spot divergences. The RSI can help identify bullish or bearish divergences, which are valuable for predicting potential trend reversals and adjusting trading strategies accordingly.

Cons
- Potential for false signals. The RSI can generate misleading signals, particularly in volatile markets or during periods of low liquidity. Traders should be cautious of these false signals.
- Not a standalone tool. Relying solely on the RSI is not advisable. It’s best used alongside other analytical tools and risk management practices to make well-rounded trading decisions.
- Lagging indicator. As a lagging indicator, the RSI may not always respond promptly to rapid price changes, potentially causing delays in signal generation.
- Limited effectiveness in trending markets. The RSI can sometimes provide signals contrary to the prevailing trend in strongly trending markets, reducing reliability in these conditions.
The Relative Strength Index (RSI) is a powerful tool in a trader’s arsenal, offering valuable insights into market momentum and potential reversal points. Its ability to identify overbought and oversold conditions and its versatility across various time frames make it a valuable indicator for many trading strategies. However, it’s essential to remember that the RSI is not infallible and should be used with other technical tools and risk management practices. By understanding its strengths and limitations, traders can effectively leverage the RSI to enhance their decision-making and improve their trading outcomes.


