
The Awesome Oscillator (AO) is a powerful momentum indicator developed by the legendary trader Bill Williams. Designed to measure the market’s current momentum against its broader trend, the AO helps traders identify potential reversals, trend continuations, and entry or exit points with greater accuracy. Its simplicity makes it attractive, while its versatility allows it to be paired with other technical tools for higher-probability trades.
The AO is calculated as the difference between a 34-period and a 5-period simple moving average (SMA), both plotted on the median price of each candlestick. Displayed as a histogram, the indicator fluctuates around a zero line, offering clear signals about momentum changes. While it can be traded as a standalone tool, combining AO with other indicators increases the strength of your trading strategy.
Let’s explore some of the most popular and effective Awesome Oscillator trading strategies that can help both beginners and experienced traders make better market decisions.
Essential Awesome Oscillator Trading Strategies
Zero-Line Crossover Strategy
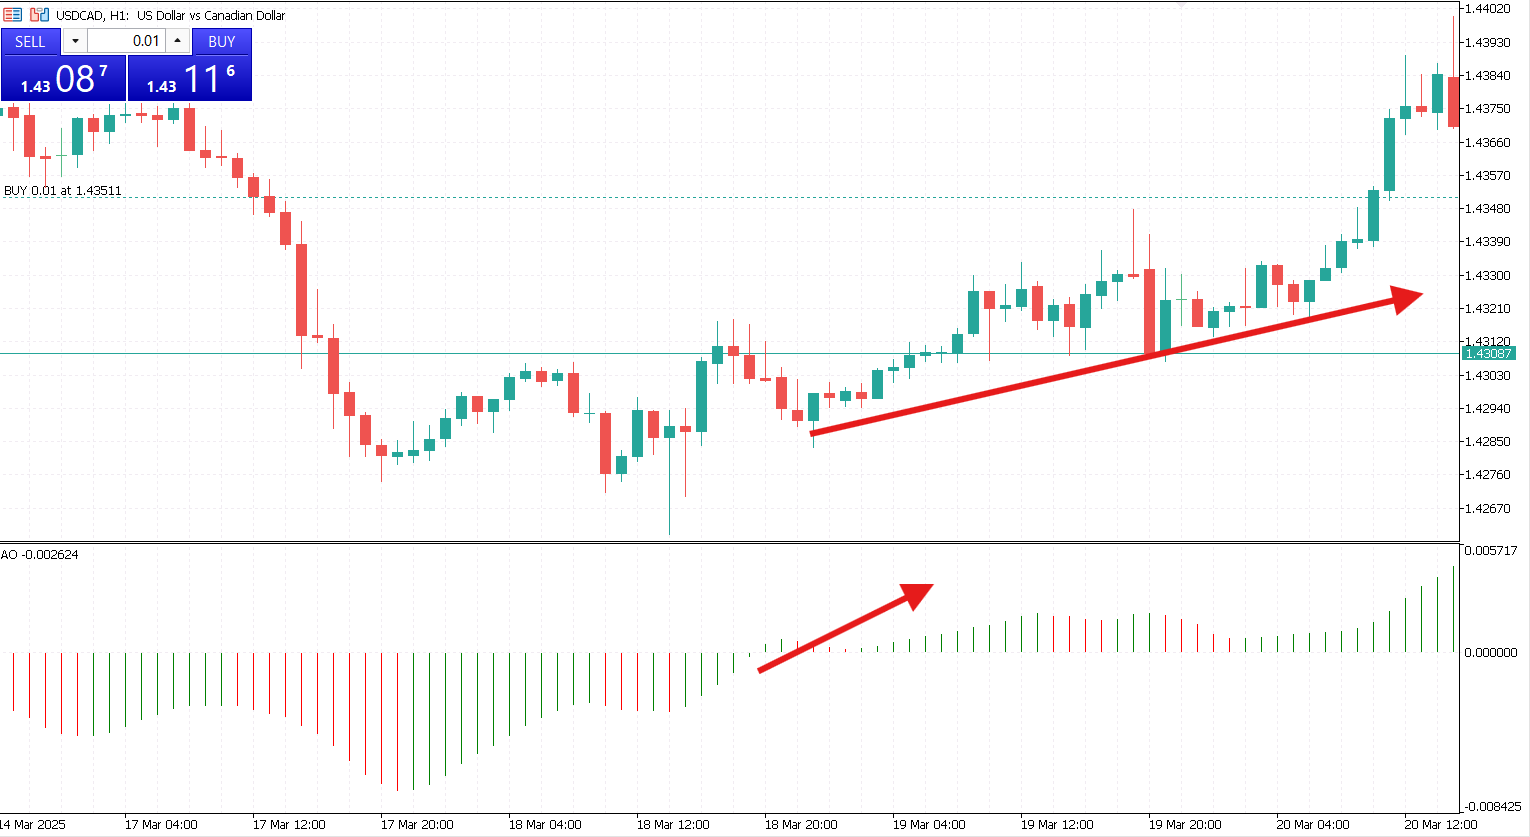
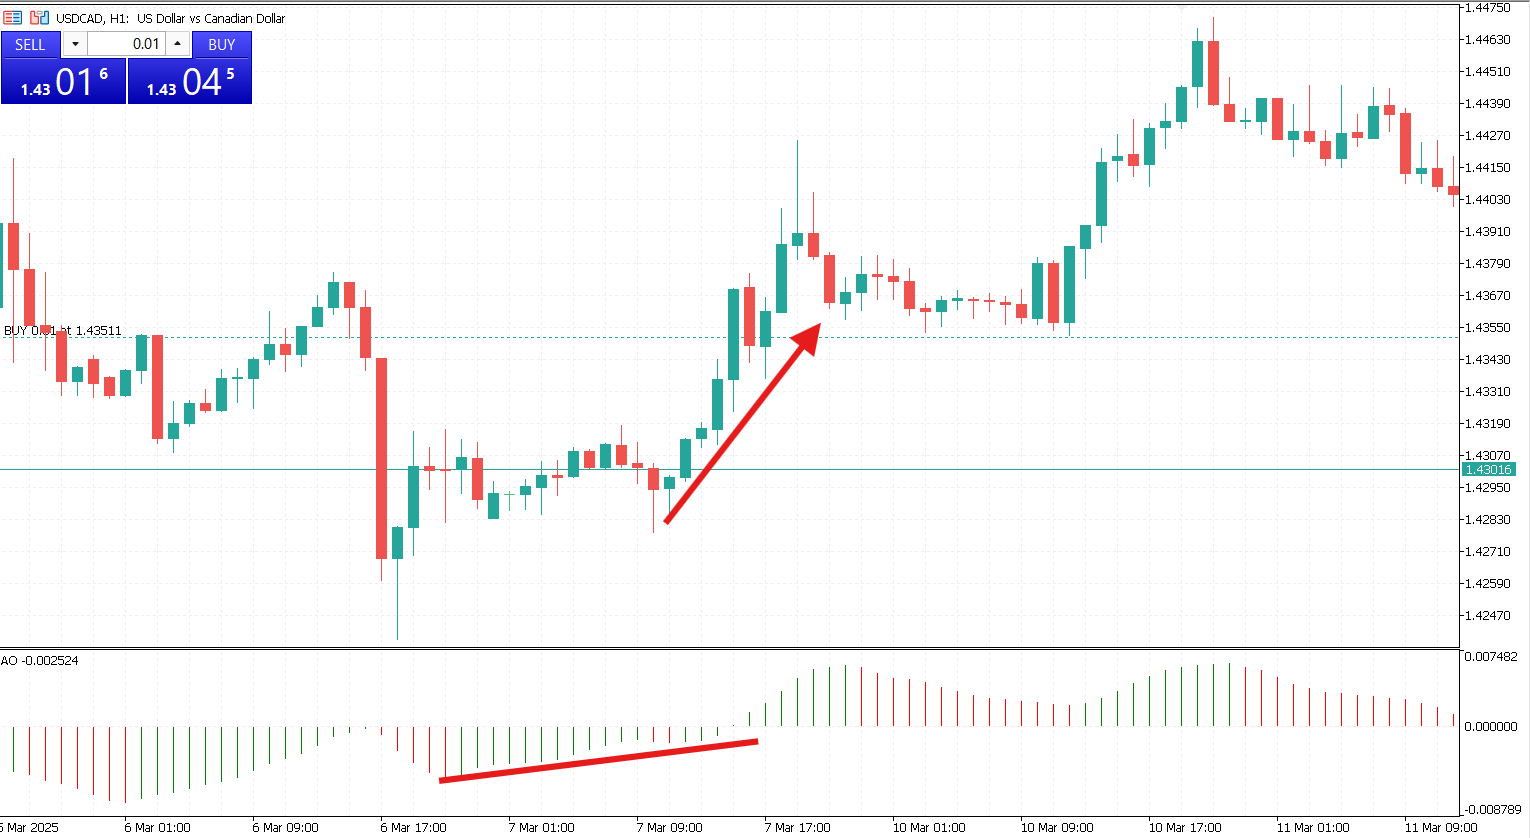
The Zero-Line Crossover is the most basic Awesome Oscillator strategy and is widely used to confirm trend direction. A buy signal appears when the AO histogram crosses the zero line from below, indicating rising bullish momentum. Conversely, a sell signal is generated when the histogram crosses the zero line from above, signaling strengthening bearish momentum.
This strategy works best when filtered with other indicators such as trendlines or moving averages to avoid false signals, especially during sideways market conditions.
Twin Peaks Strategy
The Twin Peaks setup focuses on identifying divergence and potential reversals based on momentum swings. A bullish Twin Peaks signal occurs when two consecutive lows form below the zero line, with the second low higher than the first, showing weakening bearish pressure and potential for a price increase.
A bearish Twin Peaks appears when two peaks form above the zero line, with the second lower than the first, signaling weakening bullish momentum and potential for a sell-off. This setup works well when combined with support and resistance levels to confirm reversal zones.
Saucer Strategy
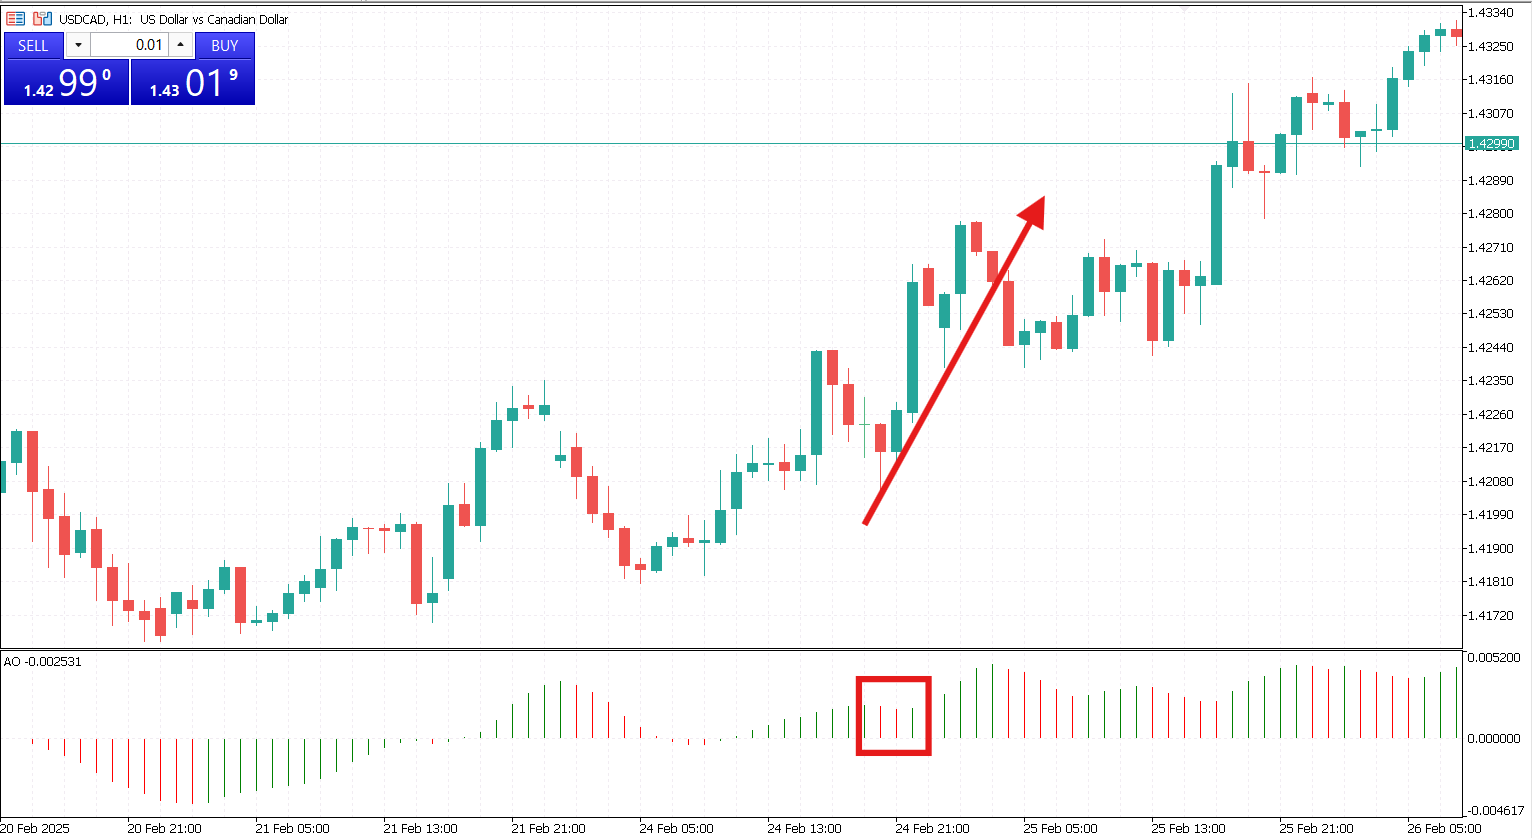
The Saucer pattern signals potential trend continuation but is considered slower and weaker due to the lagging nature of the signal. A bullish saucer appears when the AO prints two red bars above the zero line, followed by a green bar, indicating that bullish momentum is regaining strength.
A bearish saucer is the opposite – two green bars below zero, followed by a red bar, signaling bearish continuation. Since the Saucer can generate delayed signals, it is often used for short-term trades covering the next few candlesticks.
Combining AO with the Relative Strength Index (RSI)
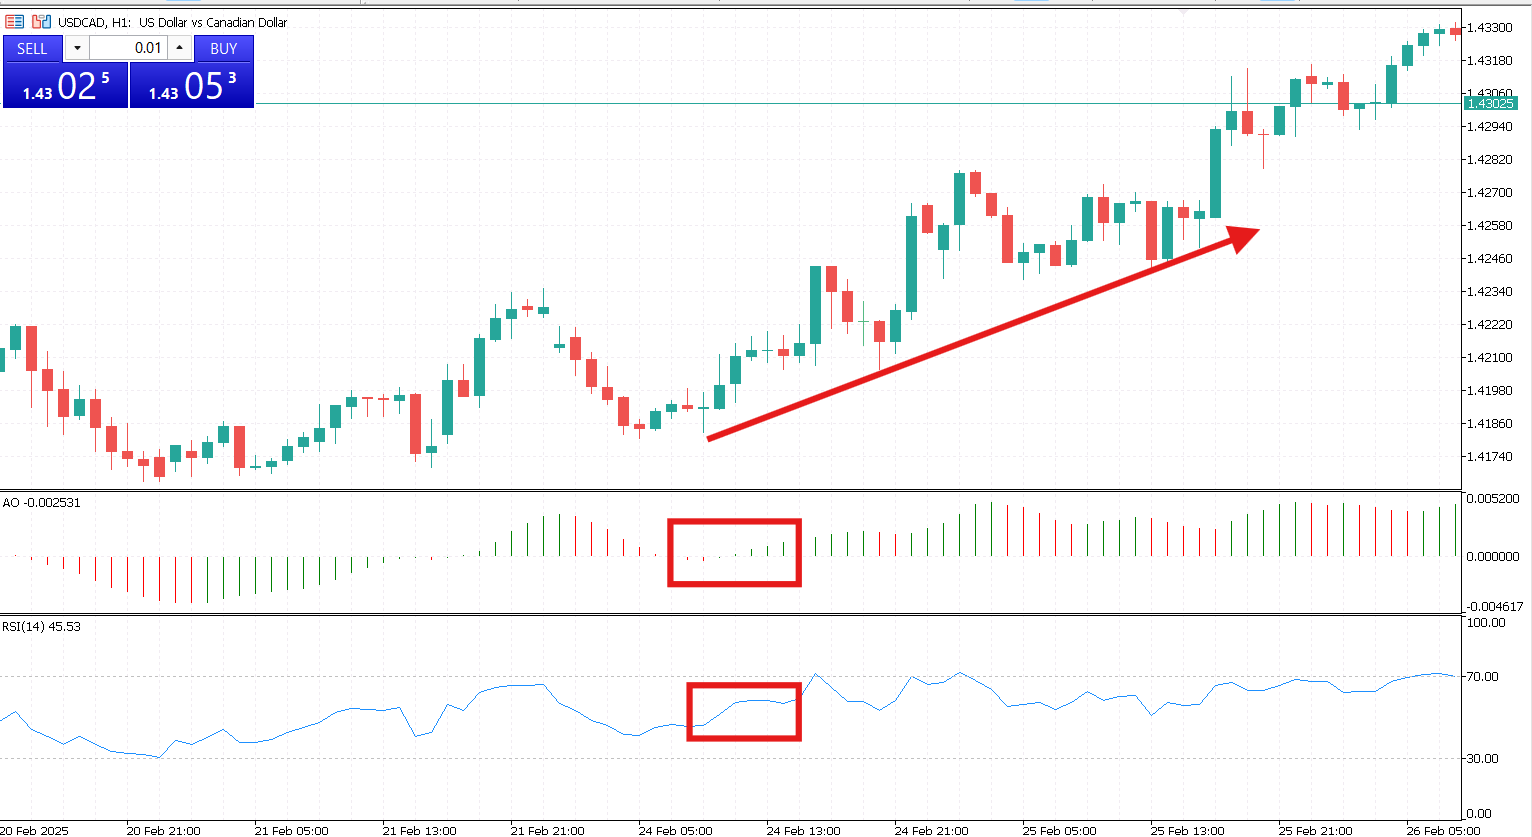
The RSI measures the speed and change of price movements, identifying overbought or oversold conditions. When combined with the AO, it provides a powerful confirmation tool.
For example, a Zero-Line Crossover buy signal from the AO is more reliable when the RSI rises above 50 or comes out of oversold territory.
Similarly, if the AO gives a sell signal while the RSI is below 50 or exiting an overbought condition, the probability of a profitable trade increases. This combination helps filter out false breakouts and enhances precision during volatile markets.
Combining AO with Moving Averages (MA Crossovers)
Moving Averages are classic trend-following tools that smooth out price action. Using the AO in combination with MA crossovers strengthens trend confirmation. For example, a bullish trade setup occurs when the price crosses above a 50-period SMA, supported by an AO Zero-Line Crossover from below.
This dual confirmation reduces the risk of entering trades during temporary price spikes or false breakouts. The opposite applies to bearish setups where price drops below the moving average, confirmed by AO crossing zero from above.

Combining AO with Bollinger Bands
Bollinger Bands measure market volatility and potential breakout zones. Using AO alongside Bollinger Bands enhances entry precision. A buy signal can be considered when the price hits the lower Bollinger Band and the AO shows a bullish Twin Peaks or Zero-Line Crossover.
Similarly, a sell signal is validated if the price touches the upper band while the AO forms a bearish pattern. This combination is effective in volatile markets or during range-bound conditions, allowing traders to capitalize on reversals with momentum confirmation.
Divergence Trading with the Awesome Oscillator
One of the most powerful uses of the AO is spotting divergences between the indicator and price action. Bullish divergence occurs when prices form lower lows, but the AO prints higher lows, signaling weakening bearish momentum and a potential price reversal upward.
Bearish divergence happens when the price hits higher highs, but the AO shows lower highs, suggesting bullish exhaustion and an upcoming reversal downwards. Divergence trading is especially powerful when combined with Fibonacci retracement levels or major support and resistance zones to fine-tune entry points.

Breakout Confirmation Strategy
Traders often struggle to distinguish real breakouts from false ones. The AO helps confirm breakout strength by measuring momentum during key price breaks. For instance, when the price breaks above a major resistance level, confirming the move with an AO Zero-Line.
Crossover or increasing green bars strengthens the buy signal. Conversely, a breakdown below support with rising red AO bars validates the sell opportunity. This method works well with chart patterns like triangles, rectangles, and flags.
The Awesome Oscillator is a versatile tool that provides clear visual signals of momentum changes in the market. While simple in appearance, its combination with other indicators like RSI, Moving Averages, Bollinger Bands, and support/resistance levels significantly improves the accuracy of trade entries and exits.
Whether you’re leveraging the Zero-Line Crossover, the Twin Peaks, the Saucer strategy, or combining AO with divergence and breakouts, it’s crucial to remember that no indicator is infallible. The Awesome Oscillator performs best as part of a multi-indicator system that filters out noise and confirms trends.


