
Support and resistance trading is among the most popular strategies nowadays. While simple, it allows market participants to find where local and major trends may stop and reverse. By reading this article, traders will learn more about how to draw support and resistance levels correctly.
Support and Resistance Levels
Support and resistance levels are price points in the market where traders collectively perceive an asset to be overvalued or undervalued based on current market dynamics. These levels are critical as they create significant price points that can act as barriers, preventing the price from rising further (resistance) or falling lower (support), depending on various influencing factors.
These levels are established by the collective actions and perceptions of market participants, who either buy large quantities when they believe a currency is undervalued (creating support) or sell heavily when they consider it overvalued (creating resistance). These actions result in horizontal lines or zones forming on a price chart, representing areas where the price has historically struggled to move beyond.
What Are The Reasons for Support and Resistance to Appear?
Before delving into how to draw support and resistance levels, the reasons for their appearance on charts are worth mentioning. It is worth looking at the basics of supply and demand to understand what causes the price to stop and reverse at specific points on the chart.

When demand surpasses supply, interest in an asset grows. However, at some point, the number of buyers becomes critical as fewer traders and investors want to purchase the asset at a higher price. At this moment, the quotes reverse. Therefore, a resistance level is at this point where the situation has changed.
Later, with the growing number of sellers, the price moves downward with the ever-increasing number of buyers joining the market. At some point, the volumes change drastically as the number of buyers exceeds the number of sellers. The price reverses again and starts moving higher. The point where the reversal took place is known as support.
Drawing Support and Resistance Levels
Traders can use several support and resistance indicators to find these levels. For instance, a famous moving average shows dynamic changes in supply and demand, allowing market participants to understand the direction of price fluctuations. Pivot points are another tool for pinpointing vital horizontal lines for a particular period.
However, drawing support and resistance levels on various charts will allow market participants to be independent of such tools and find key levels without applying additional methods.
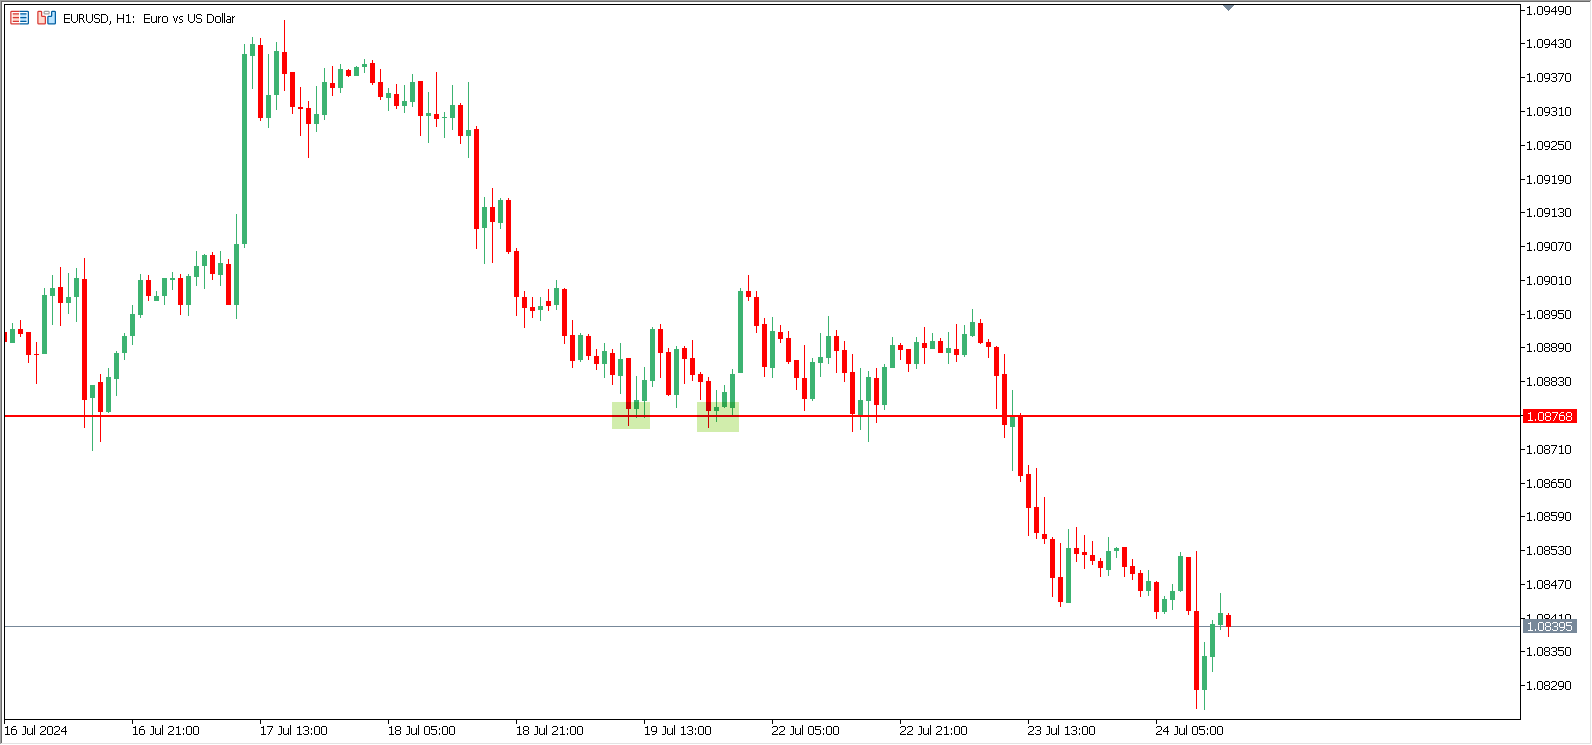
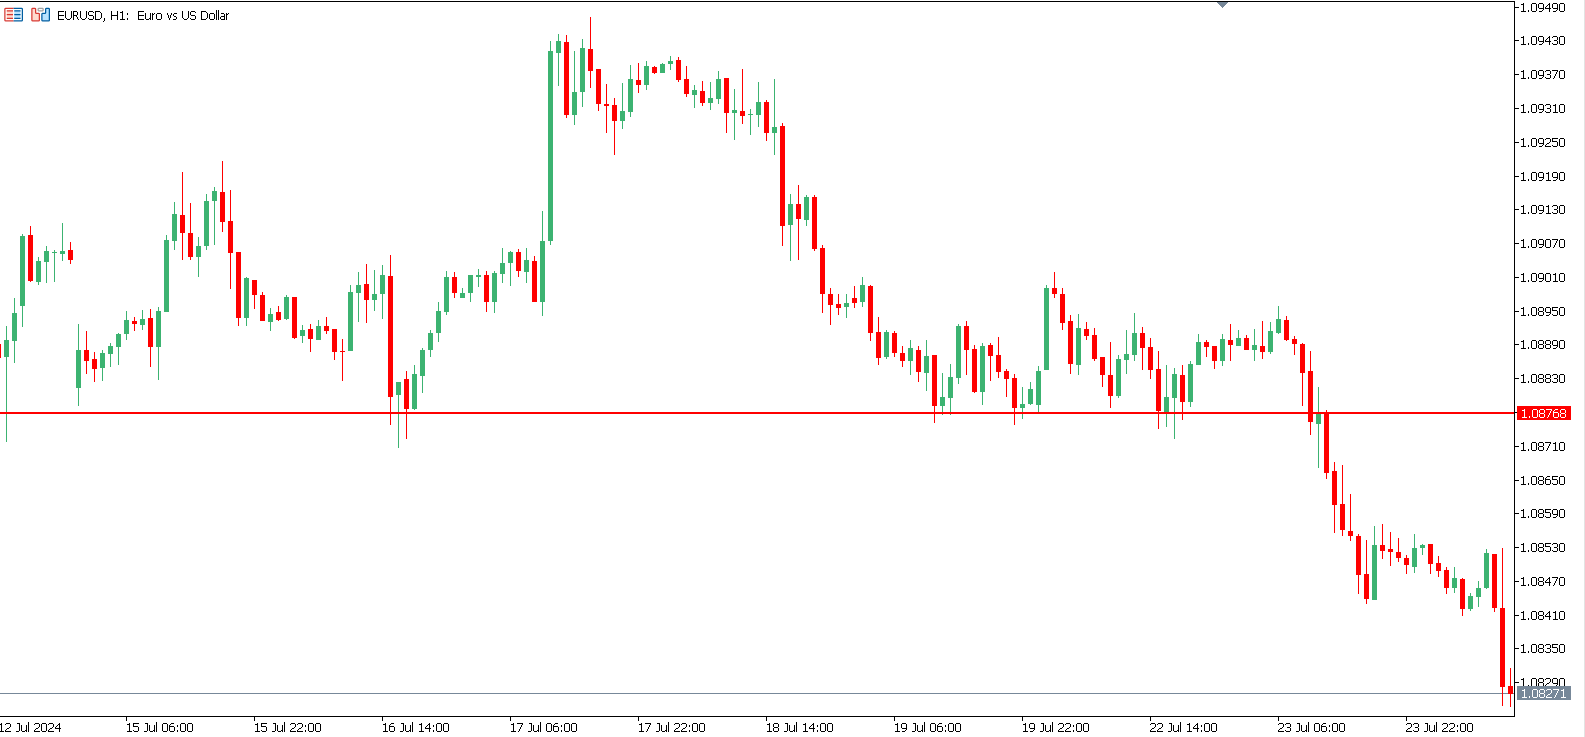
To draw a support level, one should find two points on a horizontal line where the price reverses. In the example above, there are two such points, and by drawing the line through them, traders can see where the subsequent reversal may occur. The price tests the support level again and moves higher before making the support breakout and going lower. Remember that even if the support line was broken, removing it is unnecessary as it becomes the resistance level.
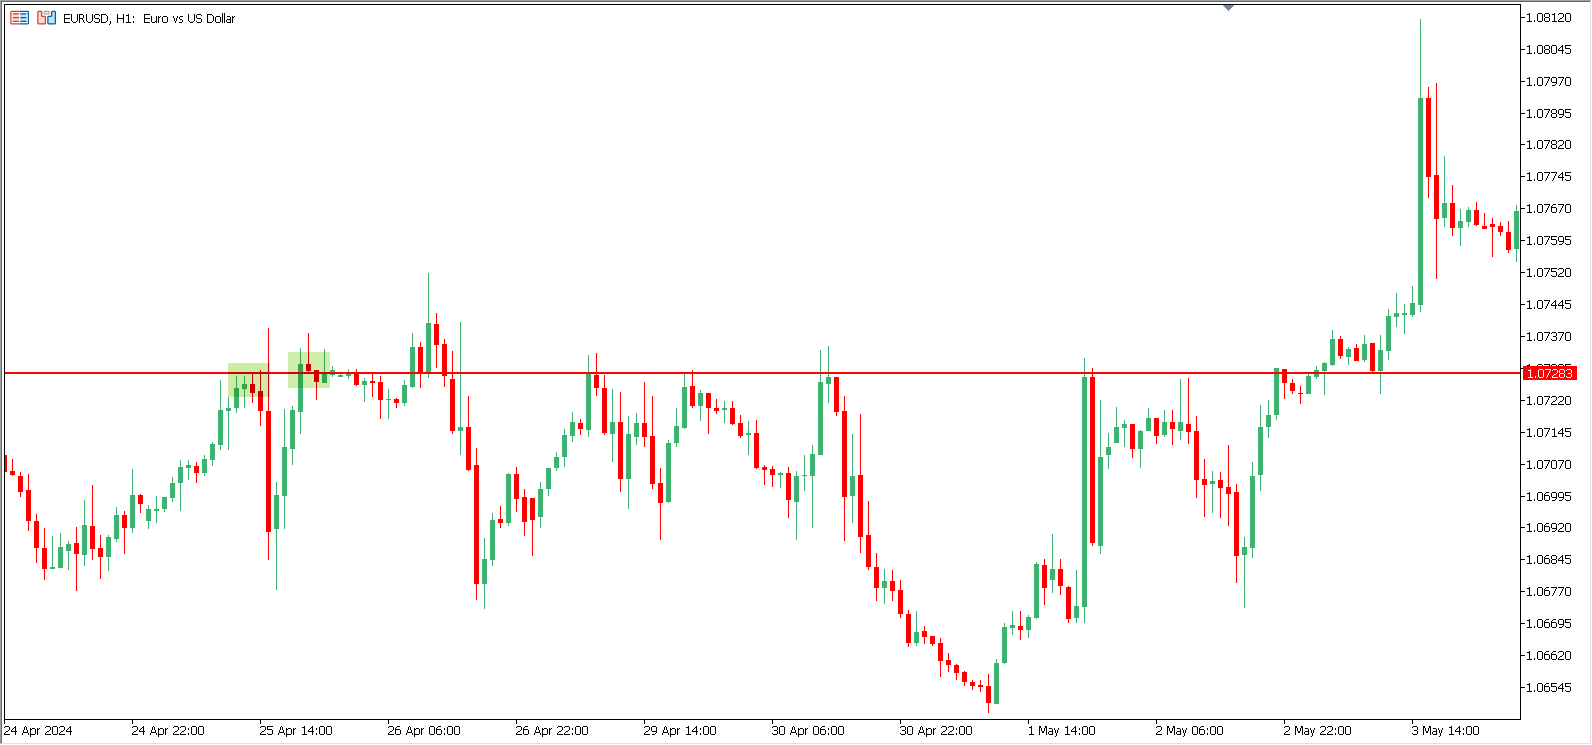
In the following example, the price growth is stopped in a particular area, known as the resistance level. Two points are pinpointed, which serve as indicators for drawing the line. Later, the price tests the resistance level many times before finally going higher. Like the support level, traders are not recommended to remove the line after the breakout as it becomes the support level.
Rules for Drawing Support and Resistance Levels
Drawing support and resistance levels is a fundamental skill in trading that can significantly enhance your ability to identify key market areas. Here are some essential rules to follow to master this technique:
- Utilize swing highs and lows. These highs and lows represent significant points of market reaction. By anchoring your levels to these points, you will more likely identify the critical levels that attract substantial buy or sell interest. These are the levels where you can anticipate valid price action signals.
- Don’t obsess over support and resistance accuracy. Market levels are rarely perfect. Instead of striving for exact matches, focus on placing your levels where they capture the most touches. This approach ensures that your support and resistance levels reflect actual market behavior and are more reliable for trading decisions.
- Concentrate on significant vital levels. Primary key levels should be easily identifiable without extensive searching. These levels are the most important and likely to produce the most critical price action signals. If you have to dig deep to find a level, it’s probably not as relevant.
- Limit the historical scope. The most relevant levels are typically found within the last six months of price action. While it can be helpful to look further back to confirm a level’s significance, focusing on recent price history ensures that your levels are relevant to the current market context.

Mastering drawing support and resistance levels is about balancing precision with simplicity. Focus on critical levels, use recent price action, and trust your instincts. Following these guidelines will enhance your ability to identify crucial trading opportunities and make more informed trading decisions.
Remember, the goal is to identify these levels as one of the most accessible and least stressful parts of your trading routine. If you spend too much time and energy on this task, you’re likely complicating it more than necessary. Keep your approach simple, and most importantly, have confidence in your abilities.


