
Support and resistance levels are essential tools in trading analysis, enabling traders to gain insights into the current state of financial markets, identify entry points precisely, and refine their risk management strategies.
Understanding these levels offers traders a significant advantage, allowing them to observe where market balance shifts occur – highlighting areas where buyer momentum weakens and seller influence strengthens, and vice versa. This article delves into the fundamentals of support and resistance levels, equipping traders with insights on leveraging them effectively in their trading sessions.
Support and Resistance Levels Basics
The support level represents the area where the selling pressure is low, and bulls become dominant. Conversely, when it comes to resistance, bulls lose momentum there while bears become stronger. Both levels provide traders with important information about the current market situation, allowing them to make more informative decisions based on the current position concerning these horizontal lines.
The area between these levels is known as the range or channel. If the price fluctuates between two levels, they call it range-bound trading. This relatively popular strategy allows traders to capitalize on horizontal price fluctuations by buying after the quotes test the support level and selling once the resistance is rejected.
To pinpoint the support level, a trader must find at least two lows at the same level. By drawing the line through these points, one can see whether the price may reverse after moving down. The resistance level, in turn, is drawn through two highs at the same level. After pinpointing it, market participants can find the level with a high potential for a reversal.
Both levels are significant for traders as they allow them to see whether the balance between bulls and bears shifts to one side. Some of these support and resistance areas are relevant for extended periods, allowing traders to use them for weeks and even months. Moreover, the price may return to a particular support or resistance years after a trader has noticed them for the first time.
One should learn to adjust the levels when trading with support and resistance. Moreover, levels are dynamic, meaning they can be broken for a while. Knowing this will help traders improve their results.

What Lies Behind Support and Resistance Levels
Two main aspects contribute to the formation of support and resistance levels: emotions and supply and demand.
Emotions
Fear. Support levels often materialize when fear is dominant. As prices decline, traders and investors fear the asset may become undervalued, prompting them to buy at certain levels, creating a support zone.
Greed. Conversely, resistance levels are often formed by greed. As prices rise, traders and investors fear the asset may be overvalued and begin to sell, creating a resistance zone.
Both emotions can simultaneously influence the formation of support and resistance levels.
Supply and Demand Imbalance
Support and resistance levels are also fundamentally tied to the imbalance between supply and demand. When there are more buyers than sellers, the price of an asset tends to move higher, creating a support level where buying pressure is strong.
When there are more sellers than buyers, the price of an asset tends to decline, creating a resistance level where selling pressure is strong.
Understanding these underlying factors helps traders effectively use support and resistance levels in their trading strategies.
How to Trade Using Support and Resistance Levels
Many strategies are based on the concept of support and resistance areas. Some use technical indicators to confirm reversals or breakouts, while others rely on price action or other graphic methods.
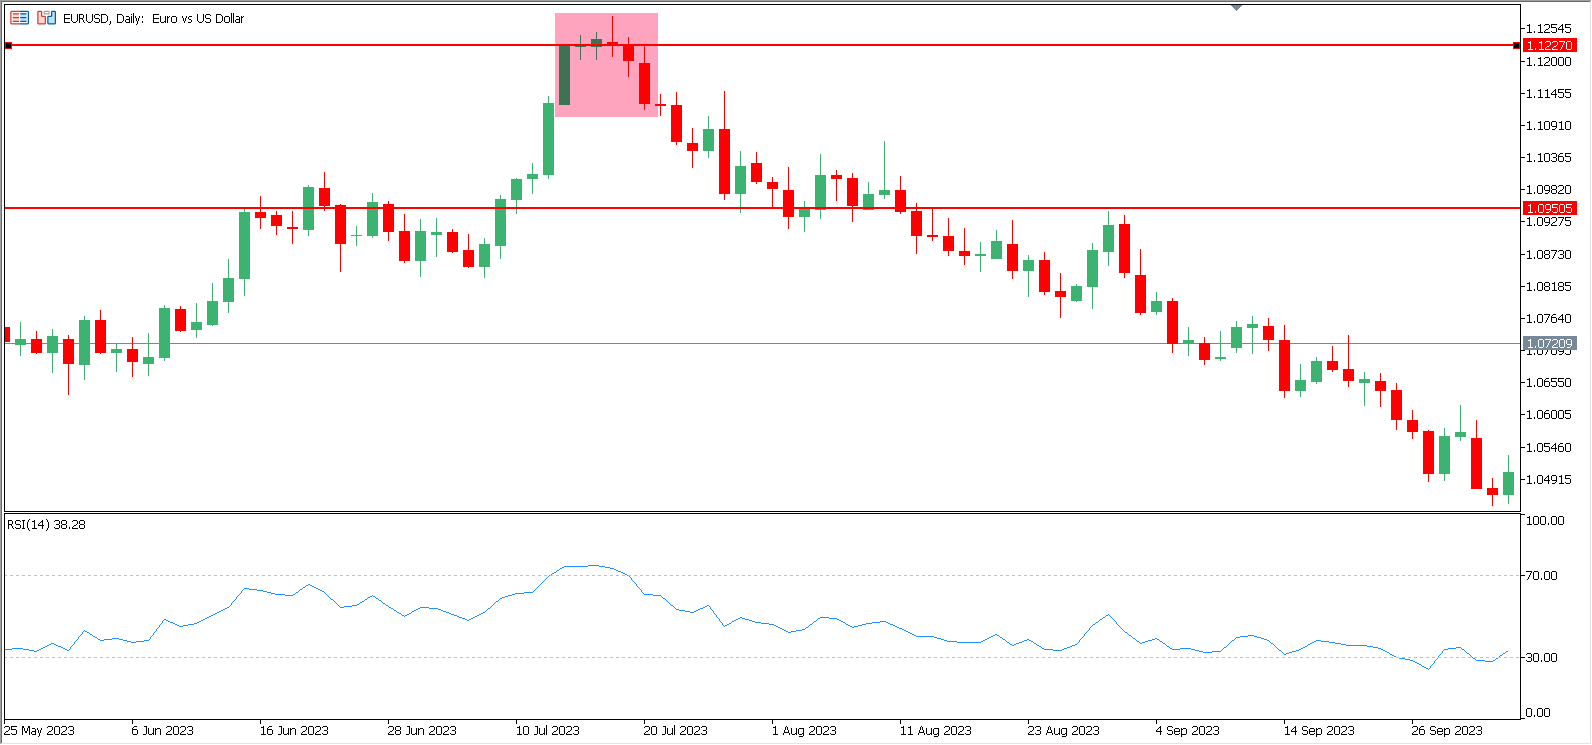
The first strategy uses levels and the Relative Strength Index indicator. The latter demonstrates the power of bulls and bears and is good in determining overbought and oversold areas. In this case, the price tests the resistance area, whereas the indicator line goes above 70, meaning the asset is overbought. The signal comes when RSI makes a breakout of 70 top-down. At this moment, the price has already left the resistance area.
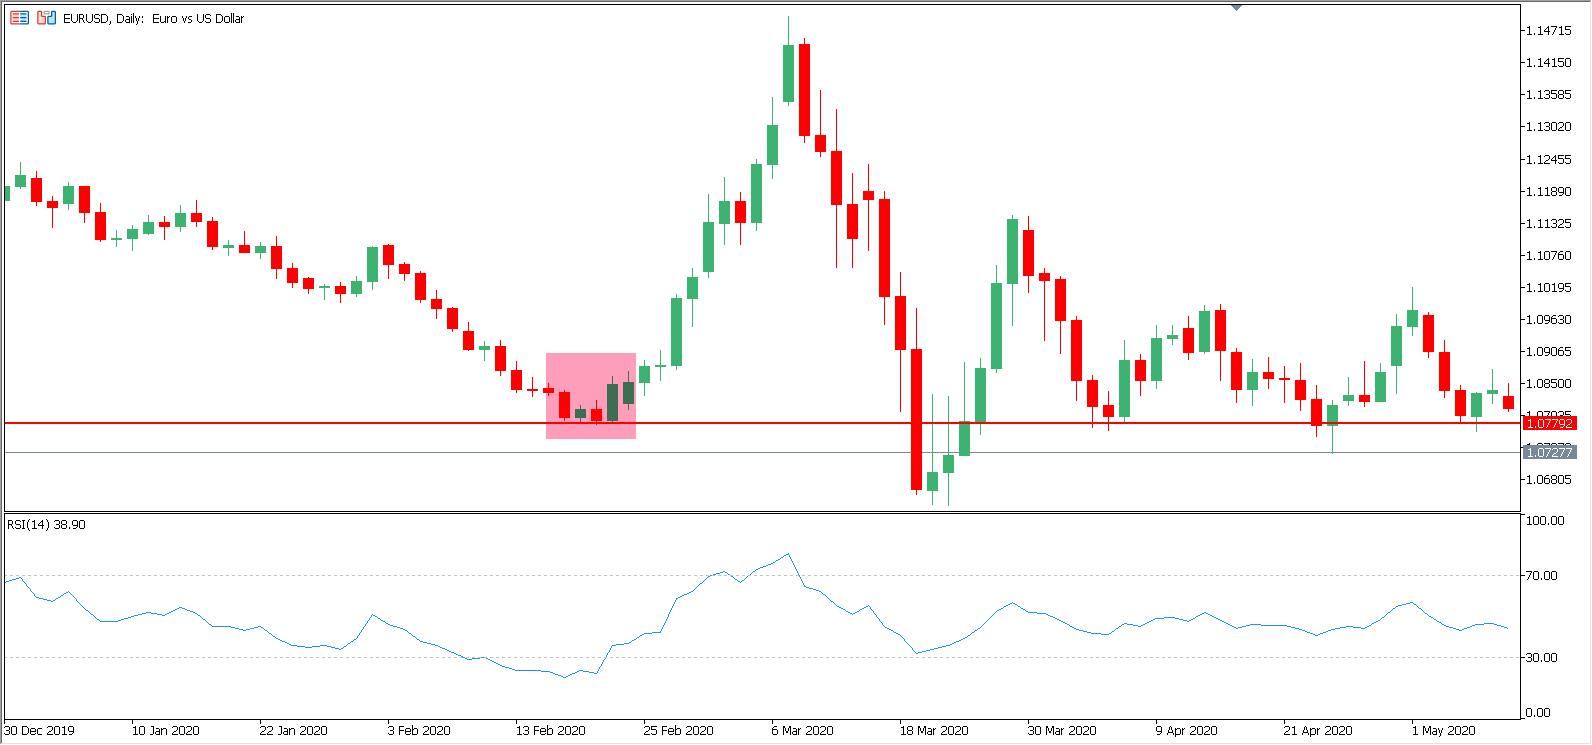
The next one uses the same principle of signal confluence, but this time, the price tests the support level while the indicator plunges below 30, which means that the asset is oversold. The buy signal comes when the line of the RSI indicator makes a breakout of 30, which means that the asset has left the oversold area.
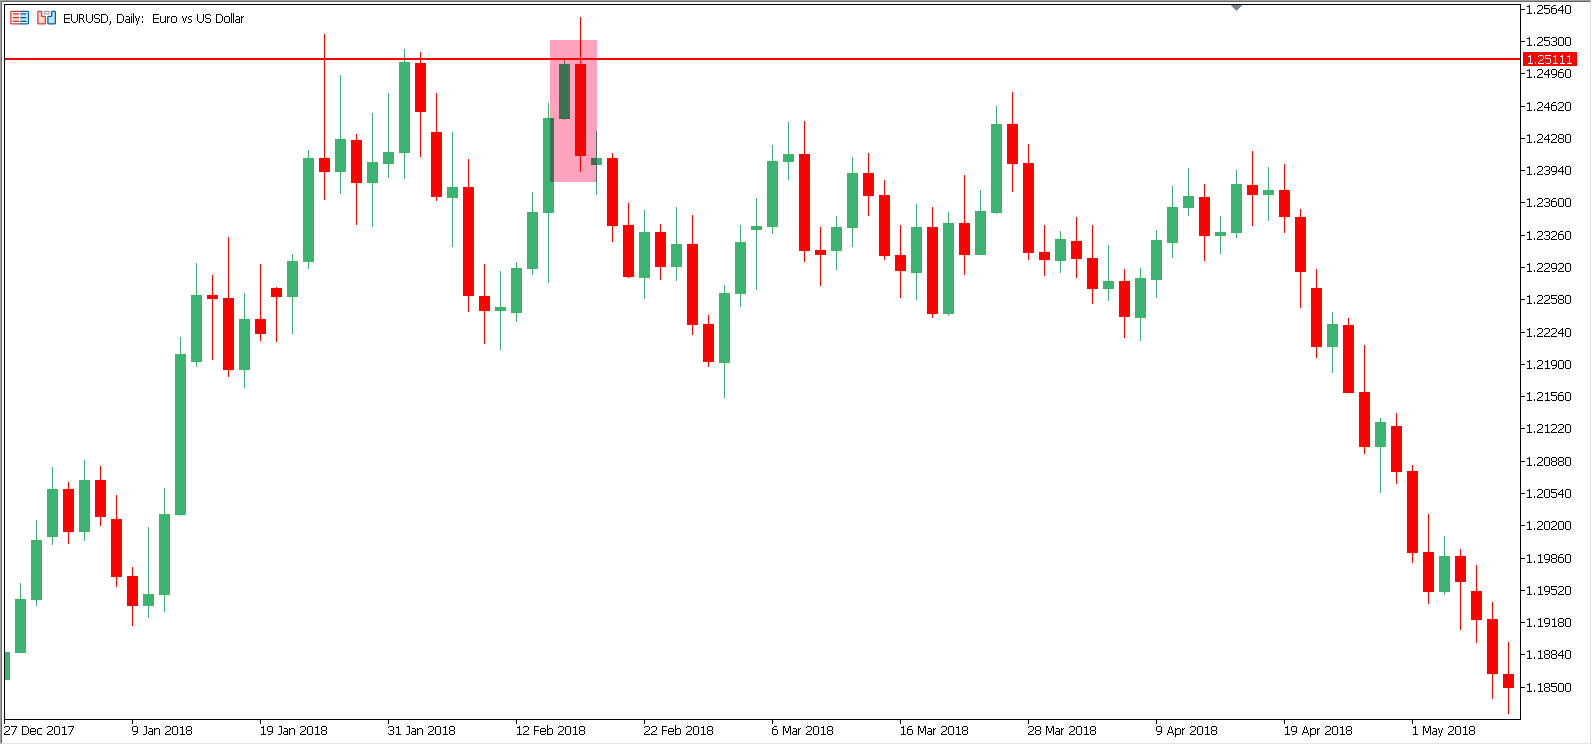
Trading with Japanese candlesticks may seem more complex due to the necessity of learning how they work. However, some simple patterns may be used by traders needing more experience. The example above illustrates how one can benefit from a situation where the price tests the resistance level and the bullish engulfing pattern appears.
Once this happens, a market participant can wait until the red candlestick that “engulfs” the green one is closed and then engage. The stop loss can be placed above the resistance level. To be more precise in placing the protective order, one can put it right above the extreme points of two candlesticks forming the pattern.
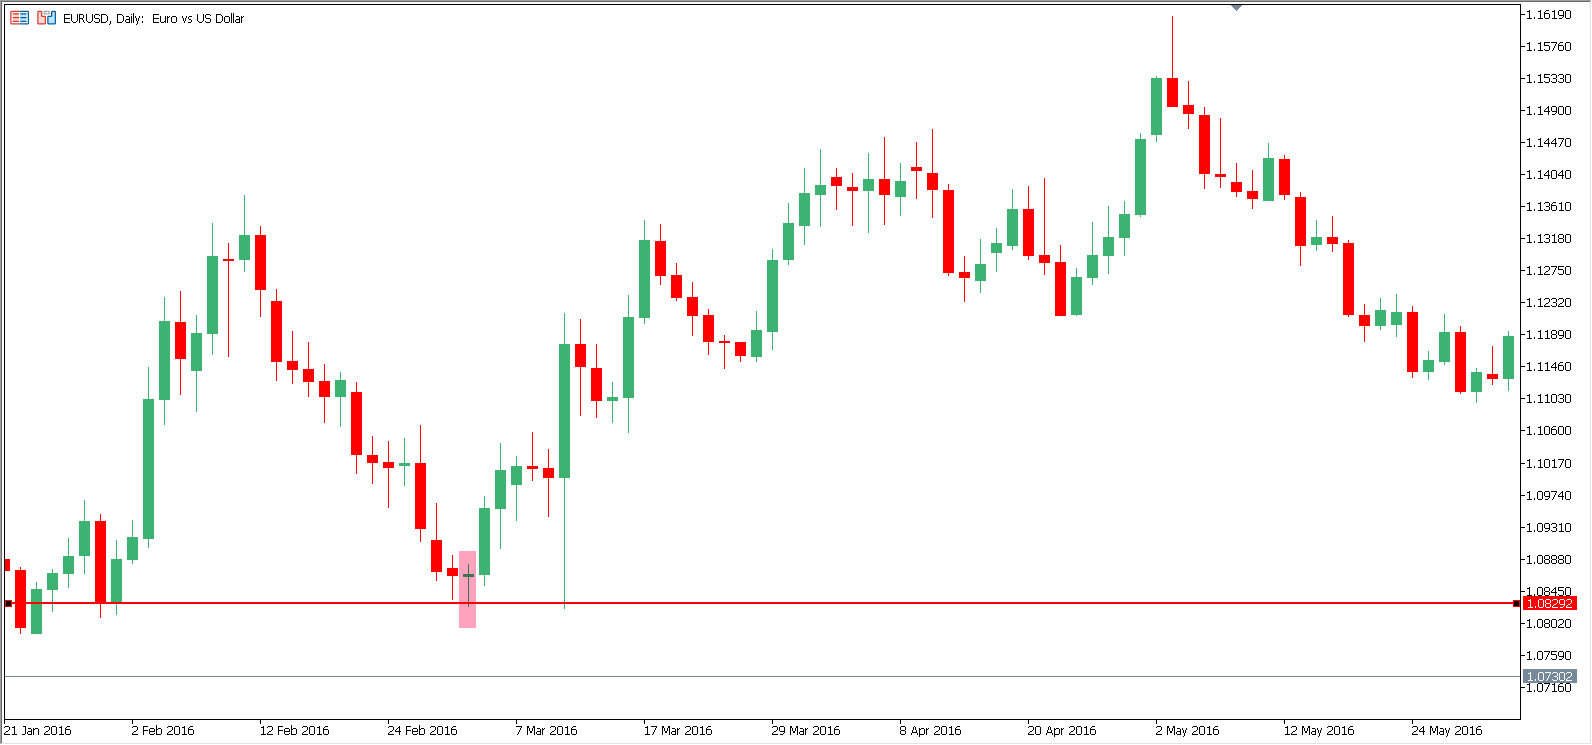
The following example illustrates how a trader can go long by buying an asset at the support level when a reversal candlestick appears. The pattern can be identified as hammer or hammer-like doji. Anyway, this is a reversal signal that one can use to buy an asset to capitalize on further growth. Once the signal candlestick closes, a trader can enter a long position. The stop loss can be placed below the support level or right below the lowest point of the reversal pattern.
Tips on How to Pinpoint Support and Resistance Levels
When looking for crucial levels where the price may reverse or even stay in a range for a while, a trader should focus on the following tips:
- Find previous highs and lows. This is the basic principle of support and resistance levels. By finding at least two lows or highs, a trader can draw a support or resistance level through them.
- Look for round numbers. Support and resistance levels are often psychological barriers, which may be found on round numbers like 1.1000 for EUR/USD, for instance, or at 1.3000 for GBP/USD. Many pending orders are placed near these levels, waiting for the price to reach them.
- Check Fibonacci levels. Adding Fibonacci retracement may be helpful. One will be able to use some of the critical lines of this indicator to find reliable support and resistance levels.
- Use trendlines. Trendlines are also support and resistance levels. Finding them may help traders understand the current price movement direction.
- Examine the quotes’ history. By scrolling to the left of the current price, a trader can find a lot of interesting clues about past quotes and fluctuations.
Trading based on support and resistance levels can be highly profitable, but mastering them is crucial before diving in. The key lies in learning how to identify and draw these critical lines accurately. By incorporating technical indicators or other analytical tools, traders can enhance their performance significantly. This approach helps in pinpointing reliable entry points and effectively managing risk levels, thereby improving overall trading outcomes.


