
The Zig Zag indicator is a popular tool for traders to filter market noise and identify significant price movements. Unlike many other technical indicators, the Zig Zag doesn’t predict future market directions. Instead, it highlights the major turning points in price action, making it easier to spot trends and patterns. By focusing on these critical swings, traders can gain a clearer view of the overall market structure, helping them make more informed trading decisions. This article explores how the Zig Zag indicator works, its key settings, and how you can incorporate it into your trading strategy for better results.
The Zigzag Indicator Basics
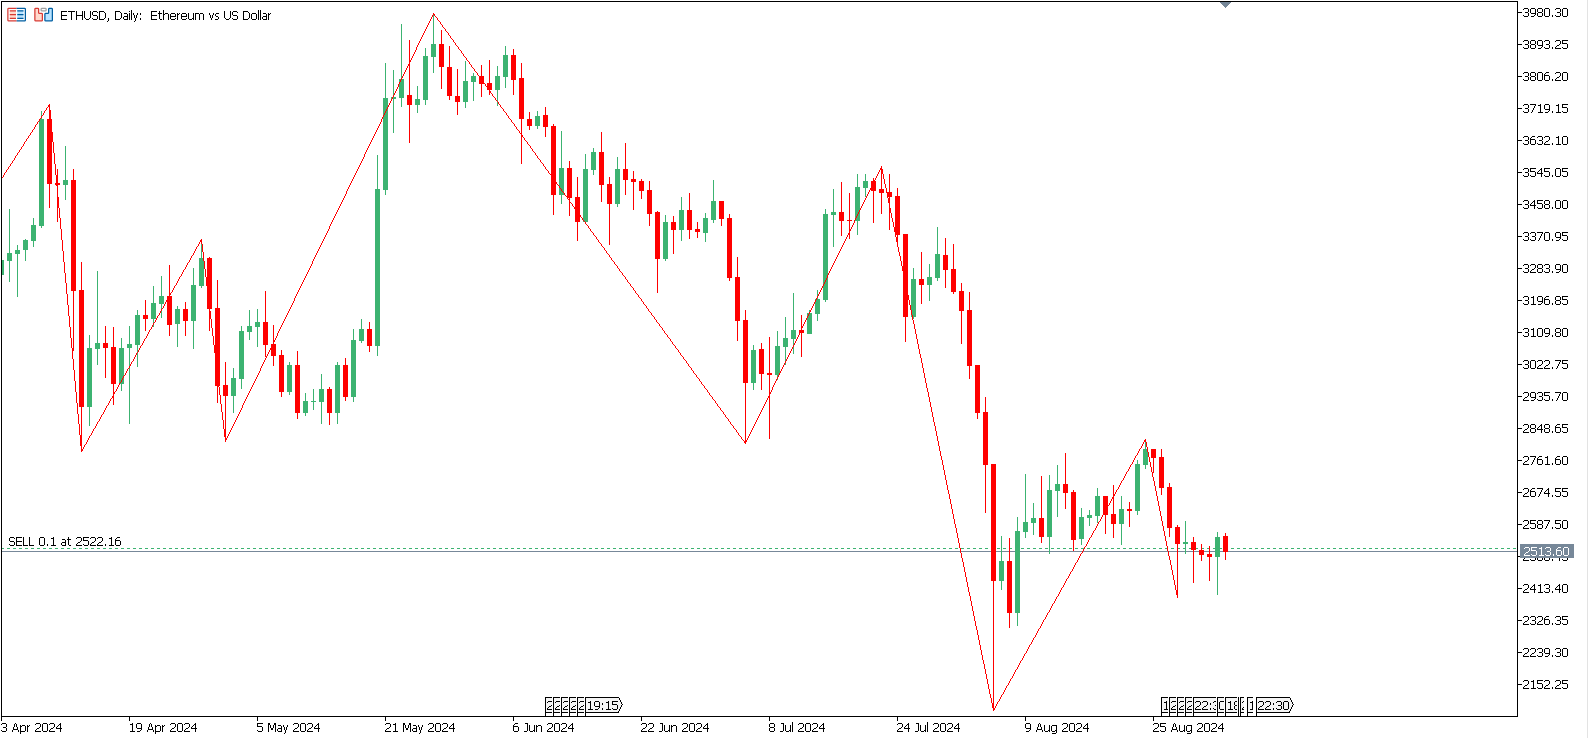
Zig Zag connects significant highs and lows, helping to filter out the “noise” from minor price fluctuations. It is considered a lagging tool since its primary purpose is to eliminate insignificant price movements. It only reflects price changes surpassing a certain customizable threshold, typically around 5-7%.
This indicator is excellent for spotting key market trends and reviewing your trading decisions. If your trades are often out of sync with an asset’s overall trend, the Zig Zag indicator can highlight those mismatches, offering valuable insights for improvement.
Although it might not be as widely known as other indicators, Zig Zag is simple. It can be easily added to most trading platforms, making it valuable to any trader’s toolkit.
The Three Key Zig Zag Indicator Settings
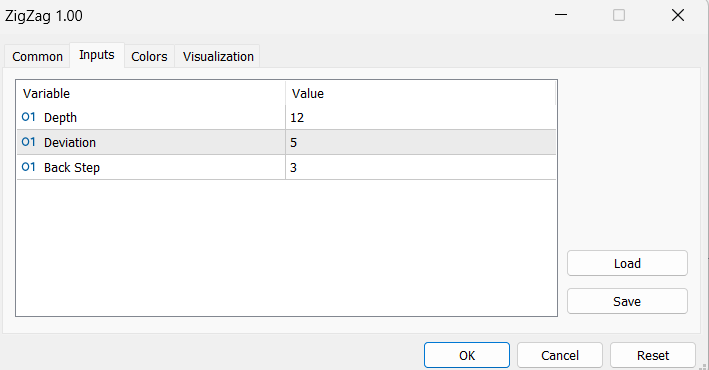
The Zig Zag indicator has three customizable settings: depth, deviation, and backstep. Adjusting these allows you to tailor the indicator to fit your trading style or specific assets.
Depth
This setting controls the minimum number of candlesticks the indicator will consider before marking a high, low, or pivot point. Typically set at 12 by default, depth helps filter out noise. If set too low, the indicator may falsely identify trends; if it is too high, it might overlook meaningful movements.
Deviation
As a percentage, deviation sets the minimum price change required to draw a trend line. The standard is 5%, meaning only price changes above this will be included. Adjust this setting based on the volatility of the asset – too low, and you’ll see too many trends; too high, and the trend line might miss critical shifts.
Back Step
Back Step defines the minimum number of candlesticks between significant highs and lows, usually three. This helps filter out minor price reversals, ensuring that the trend line accurately reflects major market movements without reacting to minor blips.
How to Use the Zig Zag Indicator in Your Trading Strategy
The Zig Zag indicator is a flexible tool that provides valuable insights into asset behavior, making it a powerful addition to your trading strategy. Here’s how you can make the most of it.
Identify Significant Price Swings
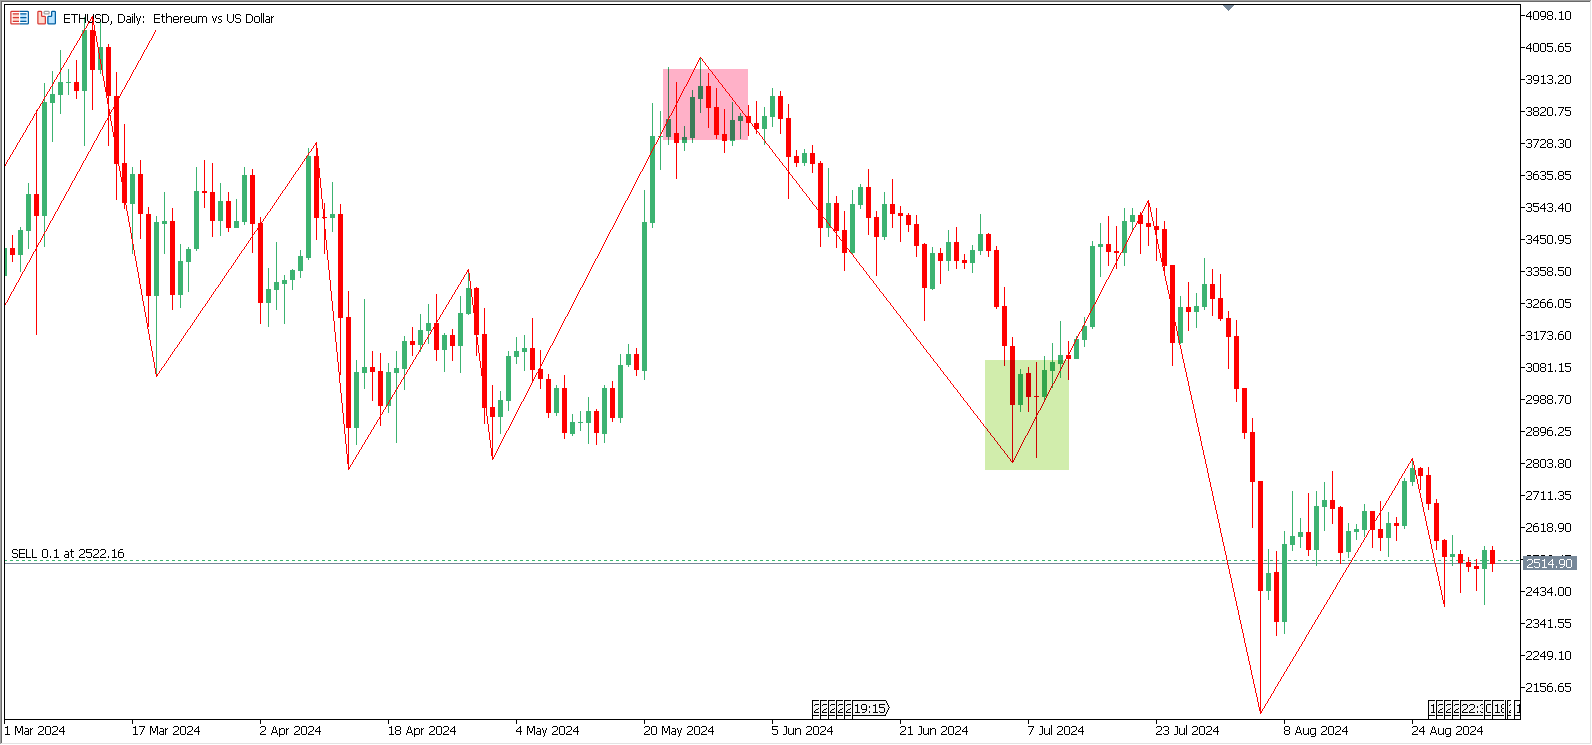
The Zig Zag indicator highlights vital tops and bottoms in an asset’s price. By identifying these significant price swings, you can better determine when to enter or exit trades, especially in a trending market. Simply apply the indicator, use the equidistance tool, or draw trend lines to visualize buying opportunities near lower levels and selling opportunities near upper levels.
Enhance Elliott Wave Analysis
Elliott Wave Theory suggests that asset prices move in predictable wave patterns. The Zig Zag indicator helps visualize these waves, making it easier to anticipate and mark market movements. This allows traders to align their strategies with the overall market direction.
Determine Optimal Entry and Exit Points
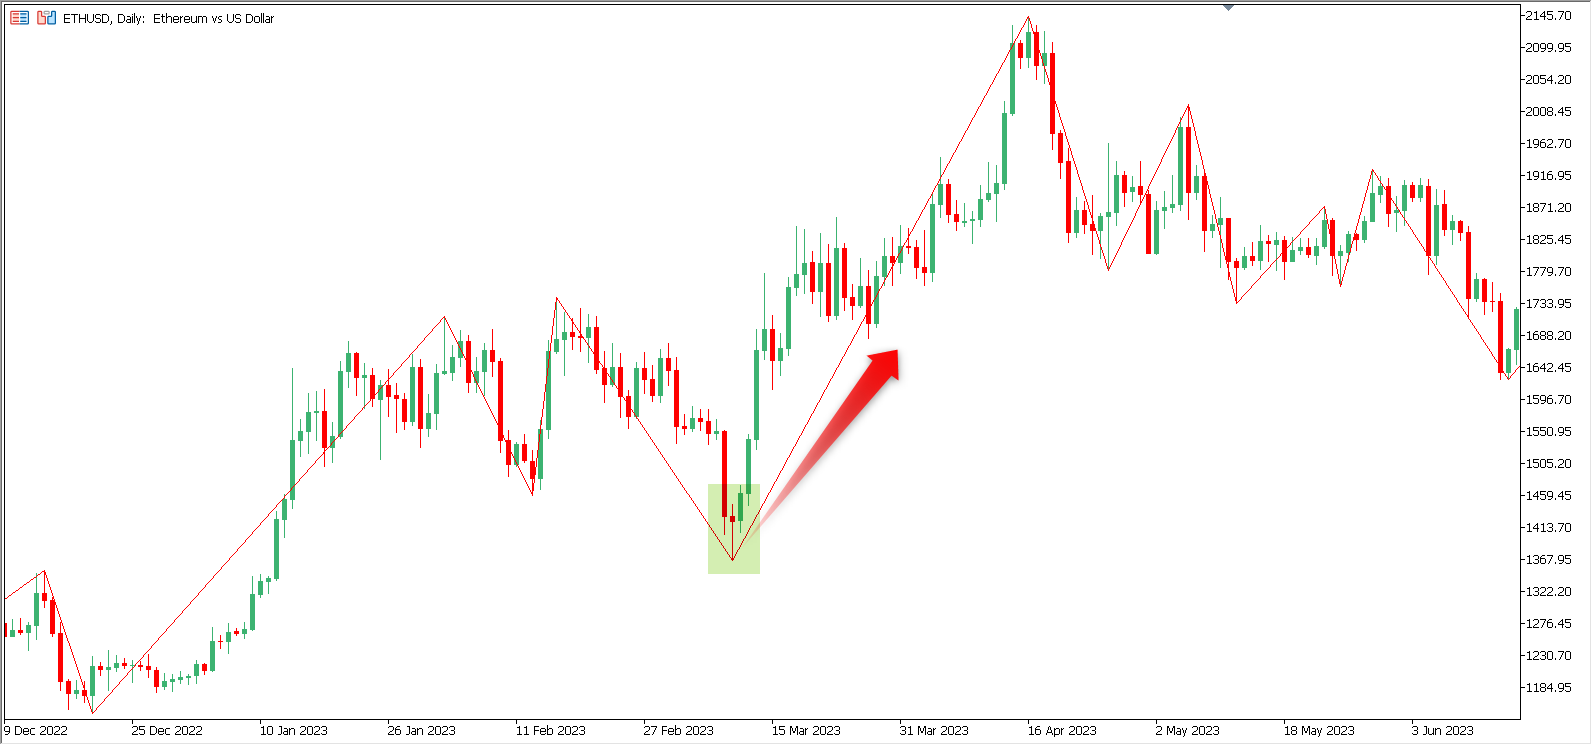
The Zig Zag indicator helps you pinpoint the best times to open or close trades by filtering out minor price fluctuations and focusing on significant trends. This can lead to more profitable trading decisions by ensuring your entries and exits are based on substantial market movements.
Confirm Trend Directions
When used alongside other analysis tools, the Zig Zag indicator can confirm the strength and direction of market trends. This dual-verification approach boosts your confidence in making data-driven decisions, helping you to establish stronger trading positions.
Spot Chart Patterns
The Zig Zag indicator can help identify classic chart patterns like head and shoulders, triangles, and double tops or bottoms. Recognizing these patterns is crucial for predicting future market movements and making informed trades.
Determine Fibonacci Retracement Levels
The Zig Zag indicator pairs well with Fibonacci retracement levels. Using the highs and lows identified by the Zig Zag, you can draw Fibonacci levels to find potential support and resistance areas within the trend.
Navigate Market Volatility
In volatile markets, the Zig Zag indicator simplifies the chart by filtering out small, insignificant price changes. This clarity helps you focus on the overall market direction, making it easier to trade confidently despite volatility.
Combine with Other Indicators
The Zig Zag indicator works well with technical tools like moving averages or the Relative Strength Index (RSI). Combining Zig Zag with moving average crossovers or RSI divergences can provide stronger, more reliable trade signals.
Incorporating the Zig Zag indicator into your trading strategy offers a clearer perspective on market movements and can significantly enhance your decision-making process. As you become more familiar with its settings and its interaction with other tools, you’ll be better equipped to navigate the markets confidently. Remember, successful trading is about continuously refining your approach, and the Zig Zag indicator is a valuable tool in that ongoing process.


