
What sets a professional trader apart from a beginner? It’s the skill to decipher charts and recognize intricate chart patterns that signal the right moments to buy or sell assets. For the seasoned trader, the key element conveying this information is the Japanese candlestick patterns.
Analysis of Japanese Candles
Candlestick analysis is a method of forecasting price fluctuations based on the study of Japanese candles – a graphical representation of market data.
The candlestick chart was invented by Homma Munehisa. He traded rice on the Japanese stock market in the late 18th century. The chart proposed by Homma clearly reflected not only the maximum and minimum price of rice during a certain period of time but also the prices at the beginning and end of the selected period.
Steve Nison introduced Japanese candles to the western world in 1991. Being a member of the board of directors of the Association of Technical Analysts, Nison did a huge amount of work, the results of which are set out in the book “Japanese Candlesticks. Graphic Analysis of Financial Markets”, where he demonstrated and described Japanese candlestick patterns.
The author claimed that all the information necessary for the trader is encrypted in the structure of the candle. Learn to read candles, and you will become a successful trader.
How to Read Japanese Candlesticks
Japanese candlesticks provide more detailed and accurate information about price movement compared to histograms. Thus, the candlestick chart informs the experienced trader:
- the opening price of a trading period,
- the closing price of a trading period,
- the maximum and minimum prices during the entire trading period.
Each Japanese candlestick consists of a body and shadows:
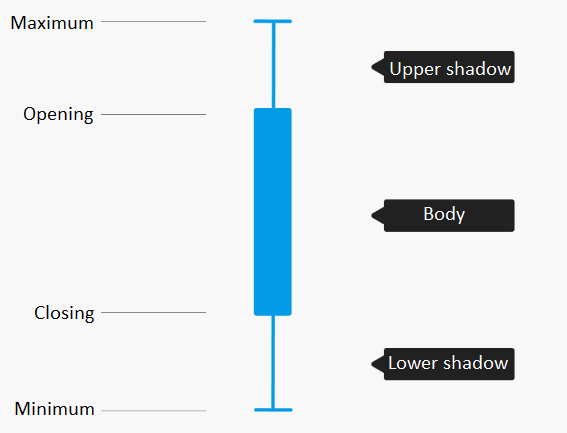
The body of a Japanese candlestick shows the opening and closing price of an instrument, the distance the price has traveled over a specific period (from the first to the last transaction). The closing price is the most important indicator that tells the direction of the opening of the next session.
The shadow of a Japanese candlestick (tail, wick) shows the maximum and minimum levels reached by the price during a certain period of time.
Types of Japanese Candlesticks
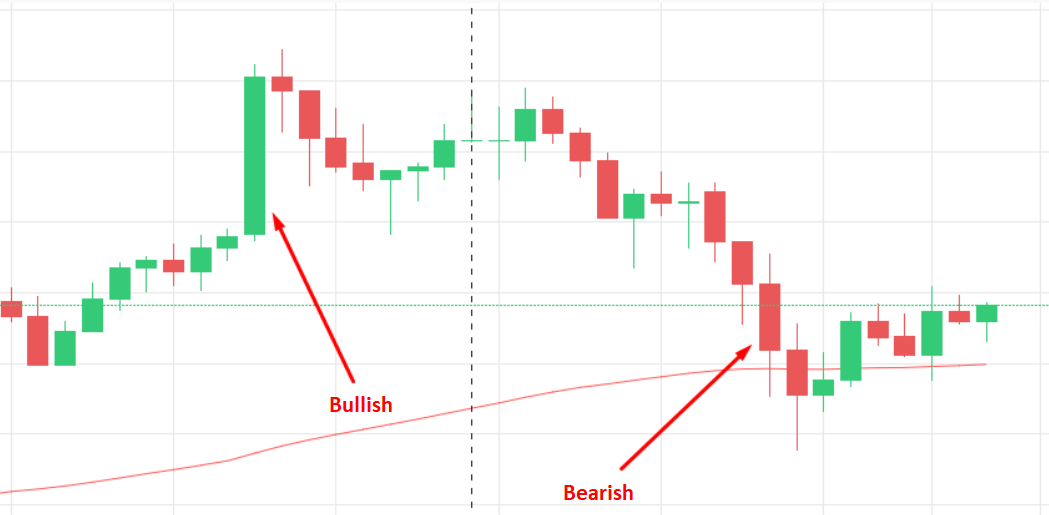
All candlesticks on the chart can be divided into two types. Depending on the direction of growth of the candle body, it will be colored in green or red and signal the direction of market movement:
- Bullish (rising) candles are green (or white) in color. They indicate a rise in price. The more buyers in the market, the higher the rising candle on the chart and the higher the demand.
- Bearish (falling) candles are colored red (or black) and indicate a decrease in price. On the chart, such a candlestick is stretched (falls) down, which indicates a greater domination for sellers over buyers and a decrease in the market.
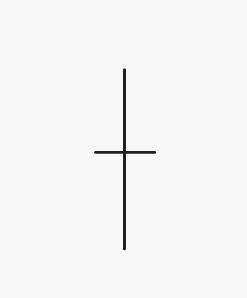
There’s also a special candlestick pattern called the Doji (which means “the same thing” in Japanese). A Doji candle shows up on the chart when the opening and closing prices are very close or even the same. Instead of a solid body, it looks like a line. When you spot a Doji on the chart, it’s a signal that the trend might be about to change direction.
Alas, the candlestick chart does not provide information about which price was earlier – the maximum or minimum. And it does not show how many times the price rose or fell.
Candlestick patterns
The patterns (figures) that candles form on the chart can be divided into three groups:
- Single – formed by one candle: Doji, Dragonfly Doji, Gravestone Doji, Bullish Spinning Top, Bearish Spinning Top, Bullish Marubozu, Bearish Marubozu, Hammer, Hanging Man, Inverted Hammer, Shooting Star.
- Double – formed by two candles: Tweezer Bottom, Tweezer Top, Bullish Engulfing, Bearish Engulfing, Bullish Harami, Bearish Harami, Piercing Line, Dark Cloud Cover, Bullish Kicker, Bearish Kicker.
- Triple – represented by three candles: Morning Star, Evening Star, Bullish Abandoned Baby, Bearish Abandoned Baby, Three White Soldiers, Three Black Crows, Three Inside Up, Three Inside Down.
Let’s consider the most popular combinations of Japanese candles.
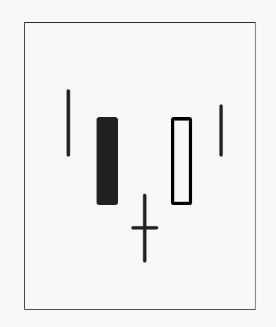
Engulfing. Double pattern:
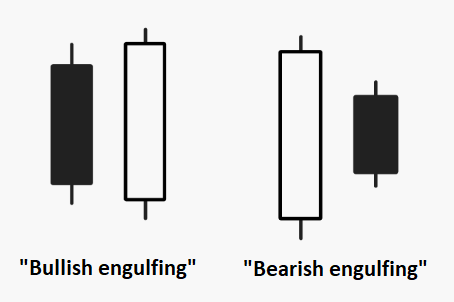
Two adjacent candles directed in different directions. One candle is clearly larger than the other. The pattern predicts movement in the direction of the larger candle.
Hammer. Single pattern:
Appears on the chart during a downtrend. The upper shadow is very small, and the candle body is significantly smaller than the lower shadow. The price is likely to move upward regardless of the candle’s color.
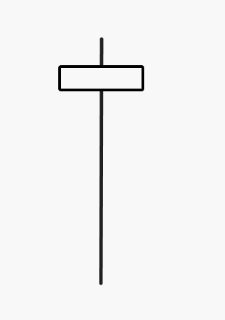
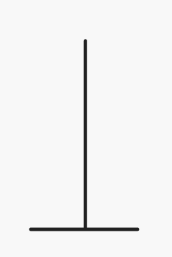
Dragonfly Doji. Single pattern:
The color of the candle does not matter. The candle body is small; the upper shadow is absent. It predicts upward movement.
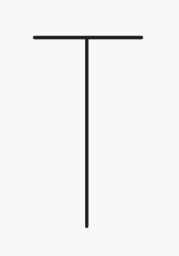
Gravestone Doji. Single pattern:
The color does not matter. The body is small. The upper shadow is significantly elongated. Such a pattern predicts a downward price movement.
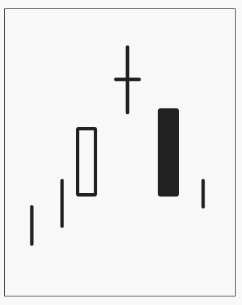
Morning Star. Triple pattern:
The first candle is bearish. The second is Doji (color does not matter), and its opening price is lower than the closing price of the first candle. A bullish candle closes the group.
Expect upward movement.
Evening Star. Triple pattern:
The first candle is bullish, followed by a Doji (color does not matter) with an opening price higher than the closing price of the first candle. A bearish candle closes the group. The pattern predicts a downward price movement.
Conclusion
Candlestick patterns are just one tool in technical analysis. They provide insights into possible scenarios, but they don’t guarantee positive outcomes. However, mastering the skill of recognizing these patterns on charts can give you a distinct advantage. I remember being inspired by Gregory Morris’ book, “Candlestick Charting Explained.” I devoured it and eagerly searched for Japanese candlestick combinations on charts. In most cases, they all worked.
However, it’s crucial not to solely rely on candlestick patterns. To enhance your forecasting skills, it’s wise to complement your analysis with indicators and other tools from both technical and fundamental analysis.


