
Most traders overload charts with indicators, but these are just lagging math, often distracting from true market behavior. Real technical analysis starts with price itself, how highs and lows form and how trends progress. At the heart of this are four elements: Higher Highs (HH), Higher Lows (HL), Lower Highs (LH), and Lower Lows (LL). By focusing on market structure instead of signals, you can identify trends, spot market shifts, and make clearer, more confident trading decisions.
By reading this article, you’ll learn how to identify valid swing structures, define trends objectively without relying on indicators, and use structural shifts to improve your entries and risk management.

What Is Market Structure?
Market structure is the organized pattern created by price as it moves through swing highs and swing lows. A swing high forms when price pushes upward, pauses, and then reverses downward, leaving a visible peak. A swing low forms when price drops, finds support, and then reverses upward, creating a clear trough.
These turning points are not random. They represent moments where buying or selling pressure temporarily overpowers the other side. When these swings begin forming in a sequence (higher highs and higher lows, or lower lows and lower highs), a trend becomes visible.
A true structural point is created by two elements: reaction and displacement. Reaction shows rejection, price respects a level and turns. Displacement shows strength, price moves away with conviction, creating a noticeable push rather than a weak drift. This is what separates meaningful structure from market noise.
Noise consists of small, choppy fluctuations with no clear momentum or follow-through. Valid structure, on the other hand, is clean, visible, and directional. If you were to sketch it, an uptrend would look like a staircase stepping higher (HH → HL → HH → HL), while a downtrend would resemble a staircase stepping lower (LL → LH → LL → LH). The cleaner the staircase, the stronger the structure.
The Four Building Blocks
Market structure is built from four simple but powerful elements: Higher Highs (HH), Higher Lows (HL), Lower Highs (LH), and Lower Lows (LL). Understanding these allows traders to read trends clearly and make objective decisions.
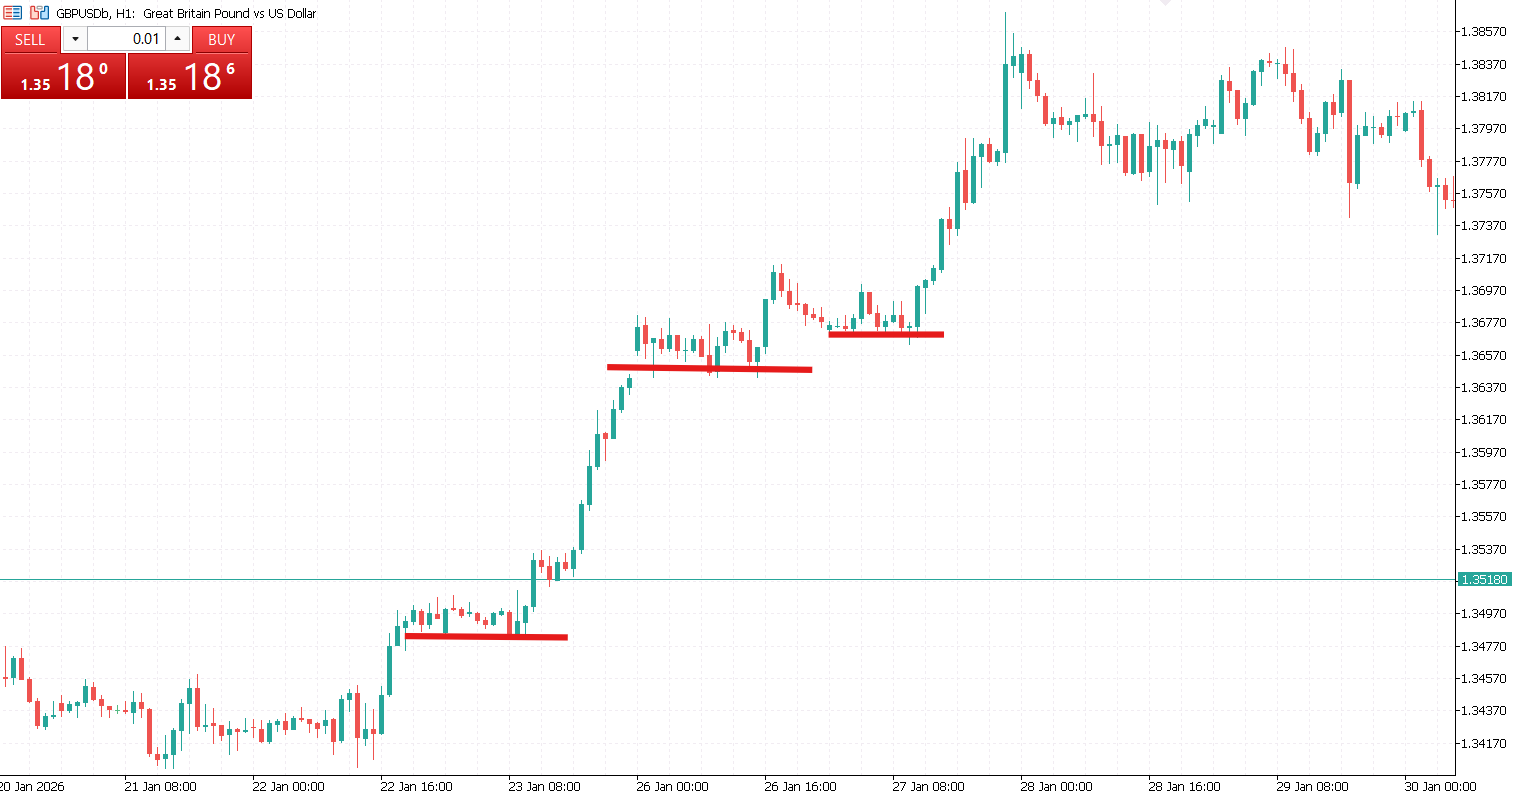
- Higher High (HH). A Higher High occurs when price moves above the previous swing high. It signals that buyers are in control and willing to push prices to new levels. For example, if the last peak was $100 and the next peak reaches $105, the market has created a HH, confirming bullish momentum.
- Higher Low (HL). A Higher Low forms when price retraces but stops above the previous swing low. This shows that buyers are stepping in earlier, reinforcing trend strength. HLs distinguish healthy pullbacks from potential reversals, if the low holds higher than the prior low, the uptrend remains intact.
- Lower High (LH). A Lower High happens when a rally fails to reach the previous high, signaling that sellers are taking control. Weak retracements that fail to surpass prior highs indicate bearish pressure and a possible downtrend continuation.
- Lower Low (LL). A Lower Low forms when price drops below the previous swing low. It confirms bearish momentum and continuation of the downtrend. Each LL reinforces the dominance of sellers, making the trend structurally stronger.
These four elements form the building blocks of all trends, giving traders a clear, practical framework to read price action without relying on indicators.

How Trends Are Formed
Trends are simply sequences of swings that reveal who is in control, buyers or sellers. By observing Higher Highs (HH), Higher Lows (HL), Lower Highs (LH), and Lower Lows (LL), you can identify the market’s direction and anticipate potential moves.
- Uptrend Structure. An uptrend forms when price creates a series of HH → HL → HH → HL. Each new high is above the previous high, and each low is above the previous low. This sequence shows that buyers are willing to pay more over time, stepping in early during pullbacks to maintain upward momentum. It reflects confidence and strength in the bullish side of the market.
- Downtrend Structure. A downtrend forms with a sequence of LL → LH → LL → LH. Each new low is below the previous low, and each rally fails to surpass the previous high. This pattern shows that sellers are dominating, consistently willing to sell at lower prices and push the market downward. It reflects bearish control and a lack of buying pressure.
- Sideways Market. When highs and lows remain roughly equal, the market lacks clear structure. Prices oscillate within a range without forming definitive HH/HL or LL/LH sequences. This lack of progression indicates indecision or balance between buyers and sellers, making trend-based entries riskier.

The Psychology Behind Structure
Market structure shows how traders behave. Higher highs form when buyers push price above previous peaks, signaling a strong uptrend. Higher lows occur when pullbacks stay above the last low, showing that buyers are keeping the trend going. Structure breaks happen when buyers or sellers take control, indicating a possible trend change. Understanding these swings, HH, HL, LH, and LL, lets traders read price action directly without relying on indicators.
Market structure is an objective way to read the market. Unlike indicators, which calculate past price data and often lag, HH, HL, LH, and LL reflect real-time buying and selling behavior. By understanding these building blocks, traders can identify trends, anticipate reversals, and make decisions based on price itself rather than formulas.
Mastering the sequences of HH/HL for uptrends and LH/LL for downtrends simplifies trading and builds confidence in entries, exits, and risk management. The key is consistent practice on clean charts, focusing only on swings and structure, so you develop a natural feel for the market. Over time, reading price becomes intuitive, giving you a clear edge without the clutter of indicators.

 in Trading")

