
Introduction to Harmonic Patterns
Greetings, everyone! Today, I want to talk about Harmonic Patterns – a special technical strategy that helps traders identify the most probable price reversal points in financial markets. These patterns are based on geometric shapes and relationships between price levels, as well as the Fibonacci sequence.
The Origin and Application of Harmonic Patterns
Harmonic Patterns were developed in the mid-20th century by an American trader and analyst, Harold McKinley Gartley. Initially, these patterns were described by Gartley in his work titled “Profits in the Stock Market,” published in 1935. Since then, Harmonic Patterns have become a useful technical analysis tool that was adjusted and modified by other analysts.
In this article, I will try to explain in simple terms what Gartley patterns are, how to identify them on charts, and how to use them in your trading. We will explore the fundamental principles and types of patterns and go through practical recommendations on how to apply this strategy effectively. I hope this information will be valuable and help you achieve success in financial markets.

Basics of Gartley Patterns
Concept and Key Principles
Gartley patterns are based on geometric shapes and proportions. They allow traders to predict potential price reversal points based on historical data. The main feature of Gartley patterns is their connection to Fibonacci numbers and ratios, which makes them particularly interesting for technical analysis.
Types of Gartley Patterns
There are several main types of Gartley patterns, each with different characteristics and applications in the market. Let’s briefly discuss each of them:
Gartley 222
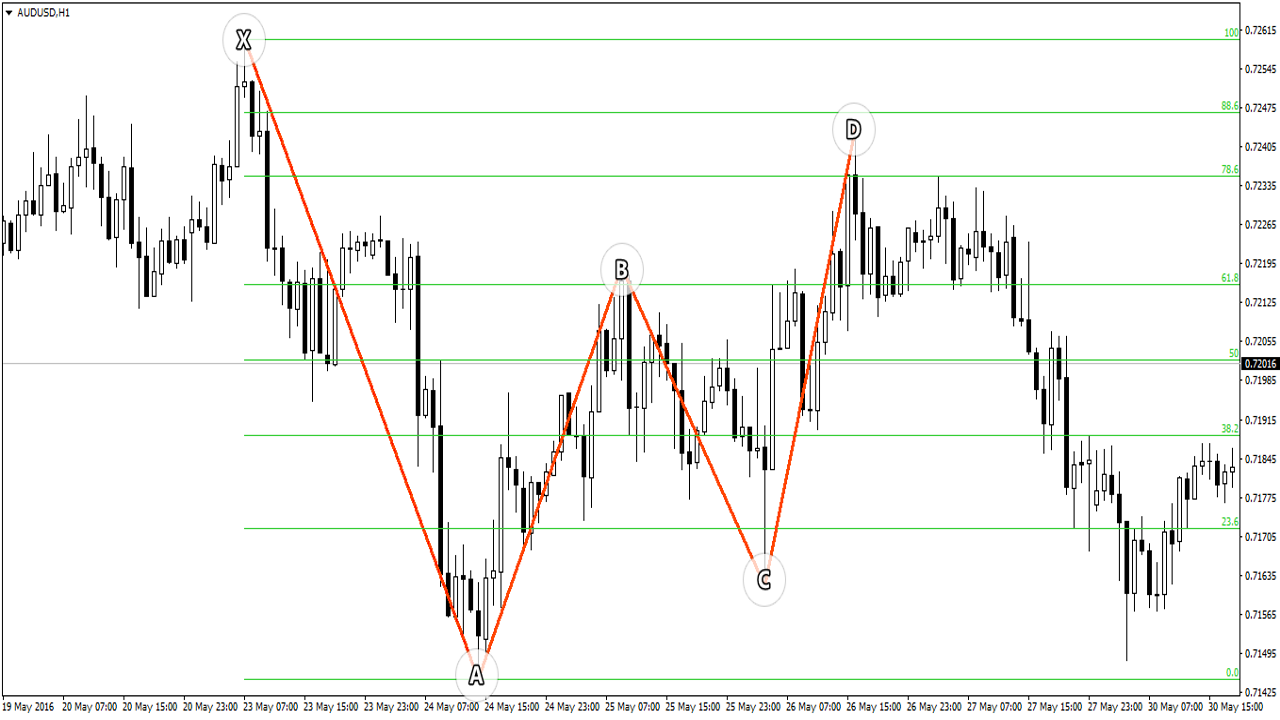
This is the classic pattern, first described by Harold Gartley. It consists of five points (X, A, B, C, D) and two correction levels (AB and CD). The pattern is named after page 222 of Gartley’s book “Profits in the Stock Market,” where it was first described.
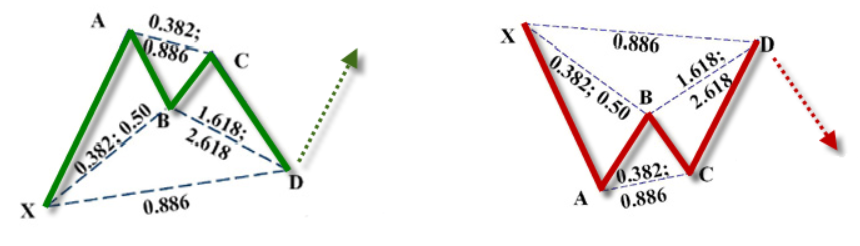
Butterfly
The Butterfly pattern is a modification of Gartley 222 and is characterized by more pronounced Fibonacci proportions. In particular, the AB level should be a 78.6% correction of the XA level, and the CD level should be a 127.2% or 161.8% correction of the BC level.
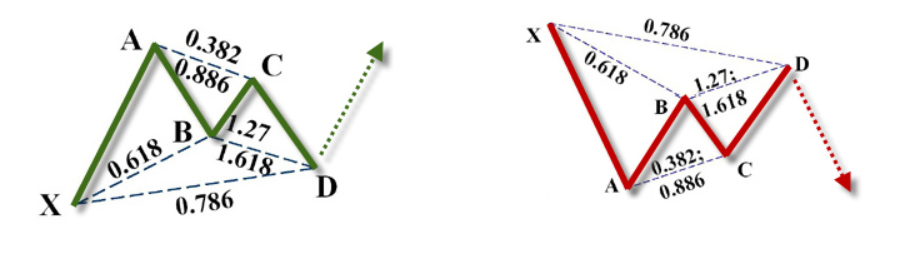
Bat
The Bat pattern is also based on Fibonacci proportions and shares some similarities with Gartley 222 and Butterfly patterns. The main difference is a deeper AB correction (88.6% of XA) and a smaller CD correction (161.8% of BC).
Crab
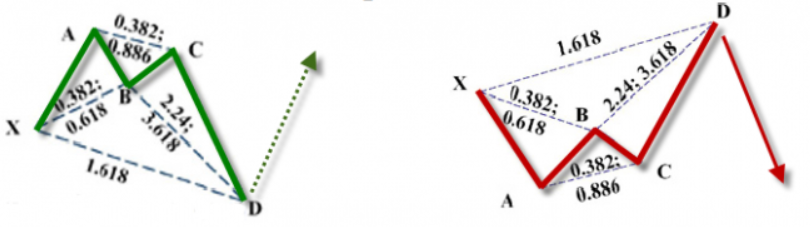
The Crab pattern is another modification of Gartley 222 with altered proportions. In this case, the AB level is corrected to 61.8% of XA, and the CD level is corrected to 224% or even 361.8% of BC. This makes the Crab pattern one of the most extreme and aggressive Gartley patterns. The Crab pattern is characterized by very deep corrections and usually strong market reversals. If you use this pattern, you should pay particular attention to stop-loss levels and risk management to avoid significant losses in case of incorrect predictions.
Fibonacci Ratios in the Gartley Pattern
One of the key features of the Gartley pattern is its close connection to Fibonacci numbers and ratios.
The Fibonacci sequence is a series of numbers in which each successive number is the sum of the two preceding ones (1, 1, 2, 3, 5, 8, 13, 21, and so on). These numbers and their ratios are often found in nature, art, and also in financial markets.
In Gartley patterns, Fibonacci ratios are used to determine relationships between different price levels and corrections. For example, in the classic Gartley 222 pattern, the AB level can be a 61.8% correction of the XA level, and the CD level can be a 78.6% correction of the BC level. Other patterns like Butterfly, Bat, and Crab also rely on Fibonacci ratios, but they have their own specific price level relationships.

Identifying Gartley Patterns on Charts
To identify Gartley patterns on charts, follow these steps:
- Select a financial instrument and a timeframe for analysis.
- Pay attention to significant price movements and corrections.
- Look for patterns that consist of five points (X, A, B, C, D) and adhere to the main Fibonacci ratios.
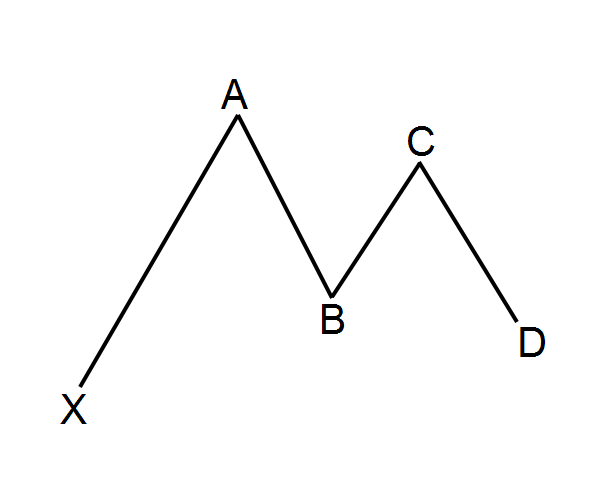
Each Gartley pattern consists of five key points:
- Point X – the start of the pattern and the reference for determining all subsequent levels.
- Point A – the first significant high or low after point X, depending on the direction of price movement.
- Point B – the correction from point A, which should correspond to the Fibonacci ratios characteristic of the chosen pattern.
- Point C – the second high or low after point A, which should also conform to Fibonacci ratios.
- Point D – the potential price reversal point, depending on the CD correction and Fibonacci ratios.
Examples of Gartley Patterns
Gartley patterns can be found in various financial instruments such as stocks, currency pairs, indices, and commodities. Here are a few examples:
- Stocks: The Gartley 222 pattern can be identified on the chart of a major company’s stock when the market experiences significant price fluctuations and corrections.
- Currency Pairs: Patterns like Butterfly or Bat can be found on currency pair charts, especially during periods of high volatility. For instance, you might spot these patterns on EUR/USD or USD/JPY charts.
- Indices: Patterns like Crab can emerge on market index charts such as the S&P 500 or Dow Jones Industrial Average. Their appearance can help forecast changes in market dynamics and determine trading strategies for index funds or options.
- Commodities: Gartley patterns can be found on charts of commodities like gold, oil, or copper.
In addition to these examples, Gartley patterns can be applied to any financial instrument that displays price fluctuations and corrections.

How to Trade Gartley Patterns
Entry Points: Point D and Stop Loss
Point D in Gartley patterns represents a potential price reversal point where you can enter a trade. Depending on the pattern’s direction, you can open long or short positions. It’s essential to set a stop-loss to minimize potential losses if the market moves in the wrong direction. The stop-loss is usually placed beyond point X or the previous significant high/low.
Exit Strategy: Determining Target Levels
When trading based on Gartley patterns, you need to identify your target levels to close trades at a profit. These levels can be determined using Fibonacci ratios. For example, you can use levels like 38.2%, 50%, or 61.8% of the CD correction to define target levels.
Risk Management and Risk Control
Applying a risk management strategy when trading Gartley patterns is crucial. Risk control involves setting stop-losses and managing position size according to your trading capital and the level of risk you are willing to take. According to the basic risk management rule, you should never risk more than 1-2% of your trading capital on a single trade.
Combining with Other Technical Tools
While Gartley patterns can be powerful tools for technical analysis, traders often combine them with other technical instruments to increase the probability of successful trades. These tools might include trend indicators (e.g., moving averages), momentum indicators (e.g., RSI or MACD), and support/resistance levels. Using a combination of these tools can help refine entry and exit points, as well as confirm the strength and reliability of Gartley patterns.

Practical Recommendations
Application across Different Timeframes
Gartley patterns can be applied across various timeframes, from short ones (e.g., 5-minute charts) to longer ones (e.g., daily or weekly charts). However, it’s important to note that on shorter timeframes, patterns can be less reliable and prone to false signals. On larger timeframes, patterns generally provide more accurate and stable signals for trading.
Pitfalls and Common Mistakes
Among common mistakes traders make when using Gartley patterns are:
- Incorrectly identifying points X, A, B, C, and D.
- Insufficient understanding of Fibonacci ratios and their impact on patterns.
- Neglecting risk management.
It’s essential to pay attention to details and be cautious when identifying patterns to avoid false signals and incorrect strategy application.
Recommendations for Successful Trading Based on Gartley Patterns:
- Always backtest your strategy on historical data before applying it to real markets. This helps assess strategy effectiveness and identify its weaknesses.
- Don’t disregard fundamental factors like economic news, political events, etc. They can significantly impact the market and influence price behavior.
- Don’t solely rely on Gartley patterns for making trading decisions. Combine them with other technical indicators and price level analysis for a comprehensive market picture.
- Don’t wait for perfect patterns. Well-formed Gartley patterns are rare, so most of the time you’ll be working with patterns that aren’t precisely ideal. It’s important to learn how to identify the most probable scenarios and make decisions based on that data.
- Avoid overtrading. A good practice is to limit the number of open positions and the risk size for each trade. This helps preserve your trading capital and reduce potential losses.
- Don’t forget about the psychological factor. Trading in financial markets requires confidence and discipline. Remember that no strategy guarantees success, so maintaining composure and keeping emotions out of trading is vital.

How to Choose the Right Financial Instrument
Choosing the right financial instrument based on Gartley patterns depends on your experience, preferences, and available markets. For beginner traders, I recommend starting with studying patterns on currency pairs, stocks, or indices that you are familiar with. Over time, you can expand your toolkit and experiment with various financial instruments like commodities, cryptocurrencies, or options.
Summary and Conclusions
Despite the development of new analysis tools, Gartley patterns remain relevant. Studying these patterns can deepen your knowledge and enhance the effectiveness of your chosen strategy. Best of luck with your trading and mastering new trading skills!


