: How to Trade with EMA")
Technical indicators like the Exponential Moving Average are important technical analysis tools. They are widely used by traders, providing a way to smooth out price data and reveal trends that might otherwise be obscured by market noise.
While the simple moving average (SMA) has long been a staple in technical analysis, the Exponential Moving Average (EMA) offers a more responsive alternative, giving greater weight to recent price movements. This article explores the EMA in depth, what it is, its advantages, applications, and best practices for use in trading and investing.
What is the Exponential Moving Average?
The Exponential Moving Average is a type of weighted moving average (WMA) that emphasizes the most recent price data while still considering past values. Unlike the Simple Moving Average, which assigns equal weight to all data points in the period, the EMA gives more significance to the latest prices. This characteristic makes the EMA more sensitive to new information, helping traders spot trends and reversals earlier than they might with an SMA.
Advantages of Using EMA
The EMA has several advantages that make it popular among traders:
- Responsive to recent price changes. Because it weights recent prices more heavily, the EMA can detect trend changes faster than the SMA.
- Reduces lag. All moving averages introduce some lag because they rely on historical data. The EMA reduces this lag, making it more suitable for short-term trading strategies.
- Versatile across timeframes. EMA can be applied to daily, hourly, or even minute-by-minute charts, allowing traders to tailor it to their preferred timeframe.
- Enhances other indicators. EMA is often used in combination with other technical indicators, such as the Moving Average Convergence Divergence (MACD) or Bollinger Bands, to confirm trends and signals.
Applications in Trading
The EMA is a cornerstone of technical analysis and can be applied in various ways:
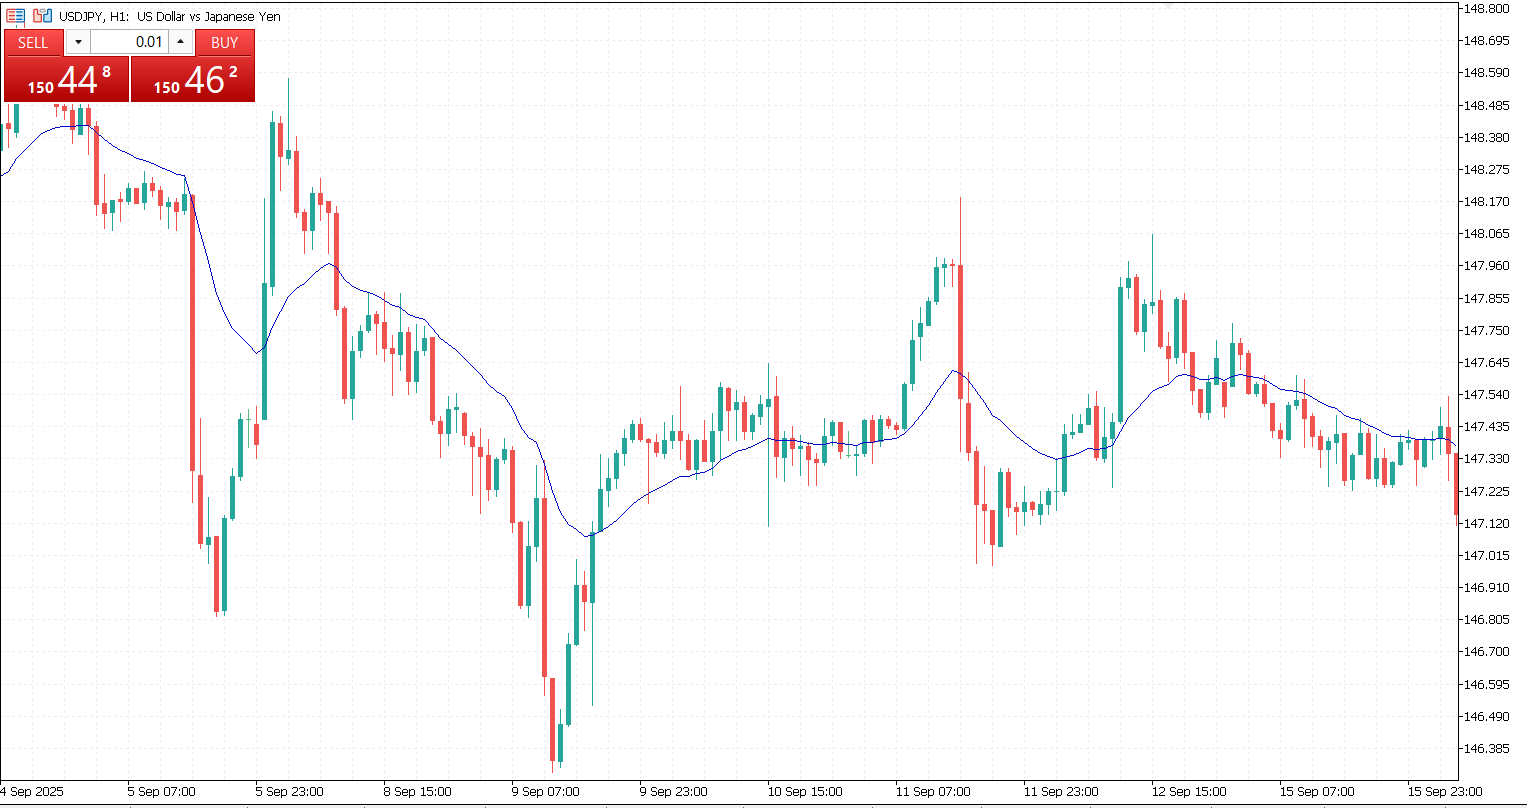
- Trend identification. Traders often use EMA to determine the direction of the market. An upward-sloping EMA suggests a bullish trend, while a downward-sloping EMA indicates a bearish trend.
- Support and resistance levels. EMA can act as dynamic support or resistance. Prices often bounce off the EMA line during trends, providing entry and exit points for traders.
- Crossover strategies. One common technique involves using two EMAs with different periods. A bullish signal occurs when a shorter-period EMA crosses above a longer-period EMA, while a bearish signal is generated when the shorter EMA crosses below the longer EMA.
- Momentum confirmation. EMA can be used to confirm momentum when combined with oscillators such as the Relative Strength Index (RSI) or stochastic indicators.
Choosing the Right EMA Period
The ideal EMA period depends on the trader’s time horizon. Short-term traders tend to favor fast-moving averages such as the 9-, 12-, or 20-period EMA, as these quickly reflect changes in market sentiment. Medium-term traders often rely on 50- or 100-period EMAs to capture broader directional movement, while long-term investors typically use the 200-period EMA to assess the overall market trend.
Selecting the appropriate period requires balancing responsiveness and reliability; shorter EMAs react more quickly to price fluctuations but are vulnerable to false signals, whereas longer EMAs provide smoother and more stable trends but lag behind rapid market shifts.

Limitations of the EMA
Although the EMA is widely used for its responsiveness, it is not without drawbacks. In volatile markets, rapid price swings can generate misleading signals that cause premature entries or exits.
Even though the EMA reacts faster than the simple moving average, it still lags behind sudden reversals and cannot predict market turning points. Furthermore, accurate EMA calculations rely on sufficient historical price data, which can be limited when analyzing newly introduced assets.

Practical Considerations for Effective Use
The EMA delivers the best results when incorporated into a broader trading framework rather than serving as a standalone indicator. Many traders enhance its reliability by pairing it with tools such as momentum oscillators, volume metrics, or divergence-based indicators.
Market conditions should also influence the chosen settings; fast-moving markets may demand shorter EMAs for timely reactions, while more stable environments might benefit from longer averages. Since the EMA is inherently trend-following, it becomes less effective during sideways or choppy price action, making it essential to confirm signals through price structure or additional analysis.

The Exponential Moving Average is an essential tool in the toolkit of any trader or analyst. Its ability to emphasize recent price action while smoothing out historical data allows for quicker identification of trends and reversals. By understanding its calculation, applications, and limitations, traders can make more informed decisions, whether they are day trading, swing trading, or investing for the long term.
While no single indicator guarantees success, the EMA’s responsiveness and versatility make it a valuable asset in navigating the complexities of financial markets. In essence, mastering the EMA is not just about drawing a line on a chart, it’s about interpreting market sentiment and timing trades with precision, turning data into actionable insights.


