
Technical indicators are essential tools that give traders insight into the pricing of various assets, including currency pairs, stocks, commodities, and cryptocurrencies. They are integral to most trading strategies today, allowing market participants to pinpoint trends, find entry points, and decide when to exit the market.
RSI, one of the most popular momentum indicators, offers many strategies that work under various market conditions. By reading this article, traders will discover the best time-tested RSI strategies catering to different categories of market participants.
Overbought and Oversold RSI Trading Strategies
One of the most popular RSI trading strategies is based on identifying overbought and oversold market conditions. The overbought area is located between 70 and 100. A trader can expect a price reversal or a temporary correction when the indicator reaches this zone and reverses downward.
These trading strategies use both the overbought and oversold areas. The oversold zone is below 30. When the RSI enters this zone and reverses upward, a market participant can anticipate an increase in the asset price or at least a correction.
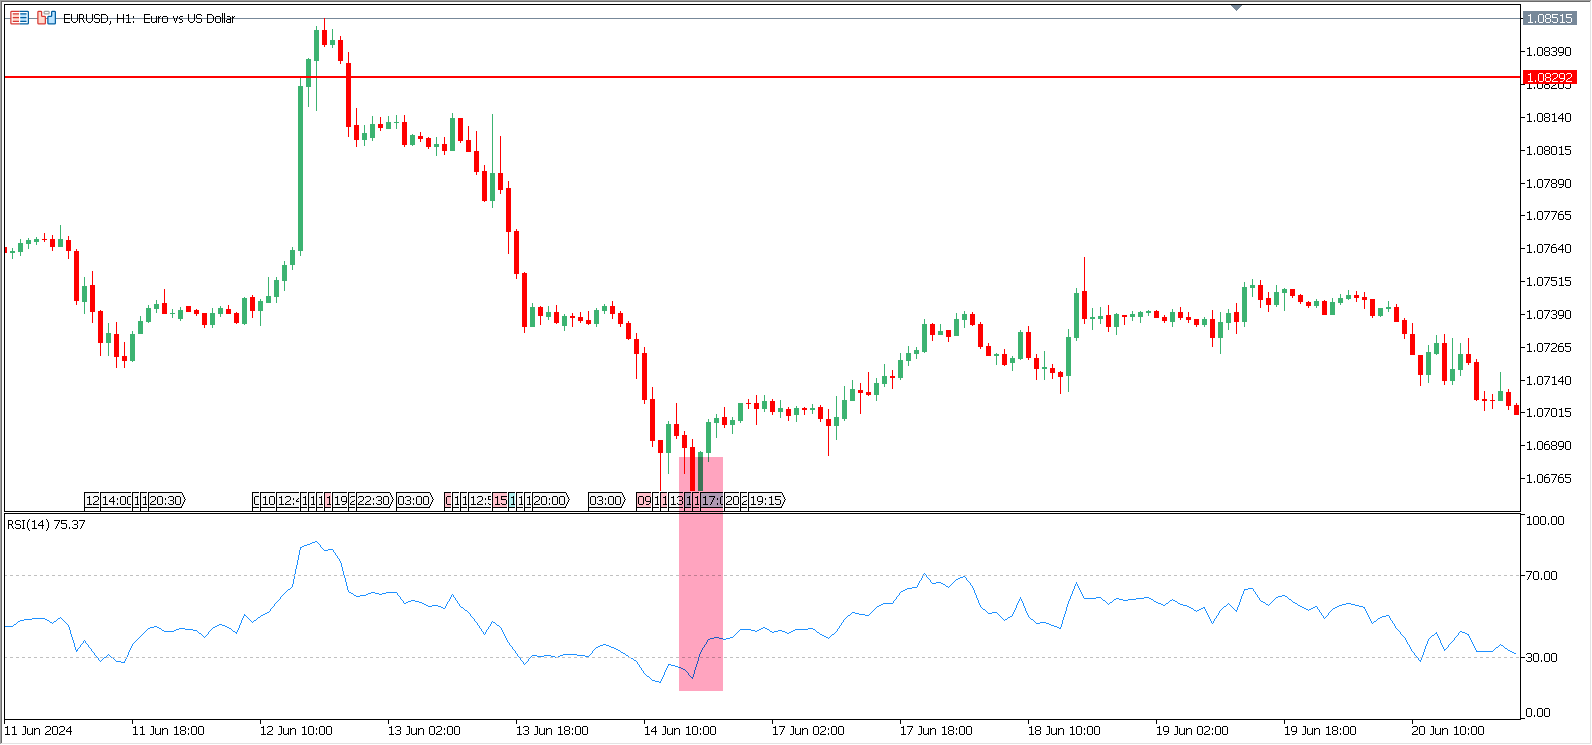
Here is an example of how it works: the indicator line is below 30, indicating that the quotes are in the oversold zone. Traders can buy an asset when the line breaks above 30. Stop losses can be placed below the lowest point of the signal candlestick.
The Best RSI Strategy with Divergence
Trading divergences is one of the best RSI strategies ever. However, a trader should first learn how to identify them.
A divergence is the difference in direction between the price and the indicator. In this situation, the price continues establishing new highs and higher lows while the indicator lines have already reversed. The line below the price can be used as a signal trendline. Once the price breaks below this trendline, market participants can go short.
The trick of this strategy is that divergences may work sideways, meaning trading with them will have little to no effect. Moreover, divergences may accumulate in some cases, exposing the trading balance to higher risks.
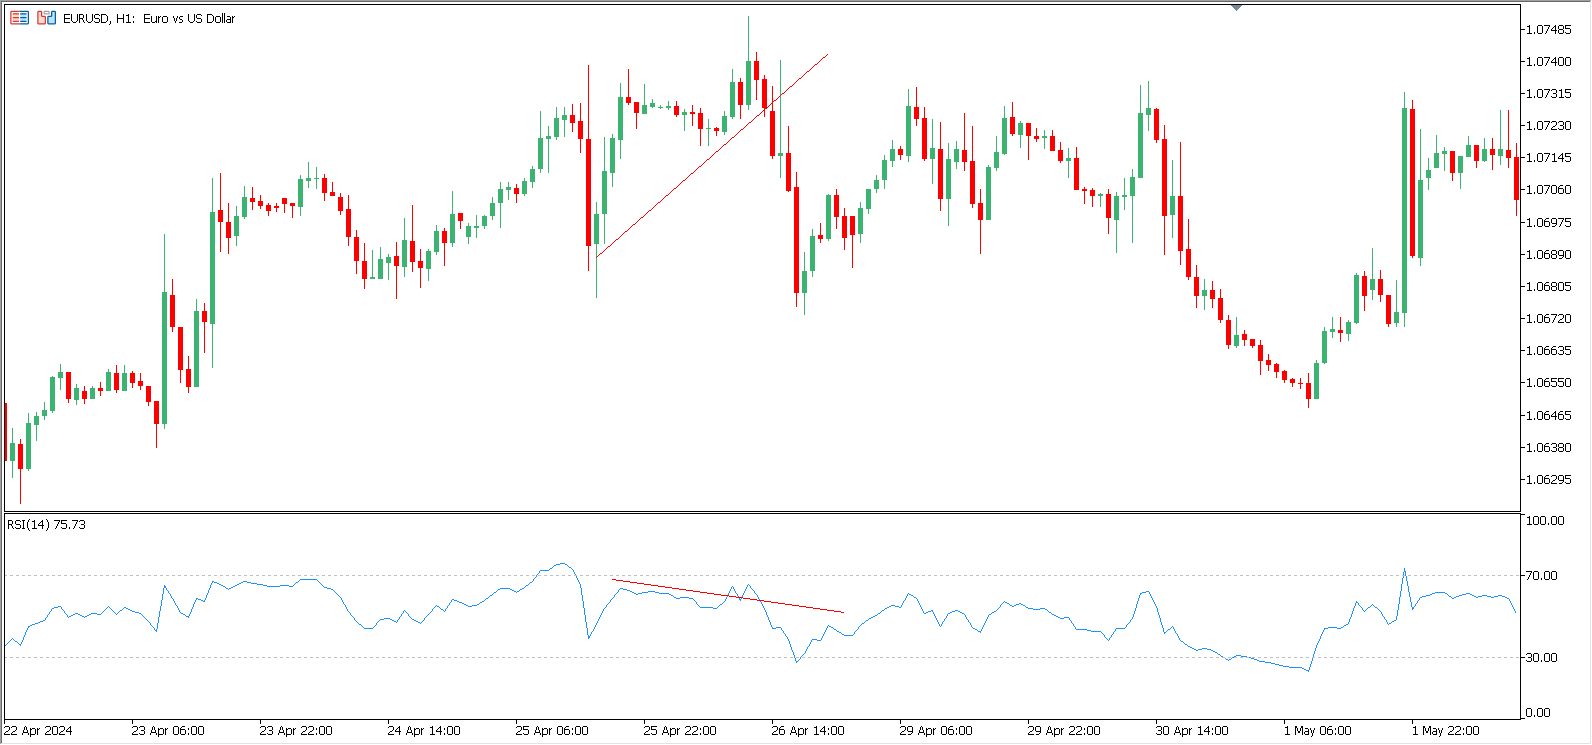
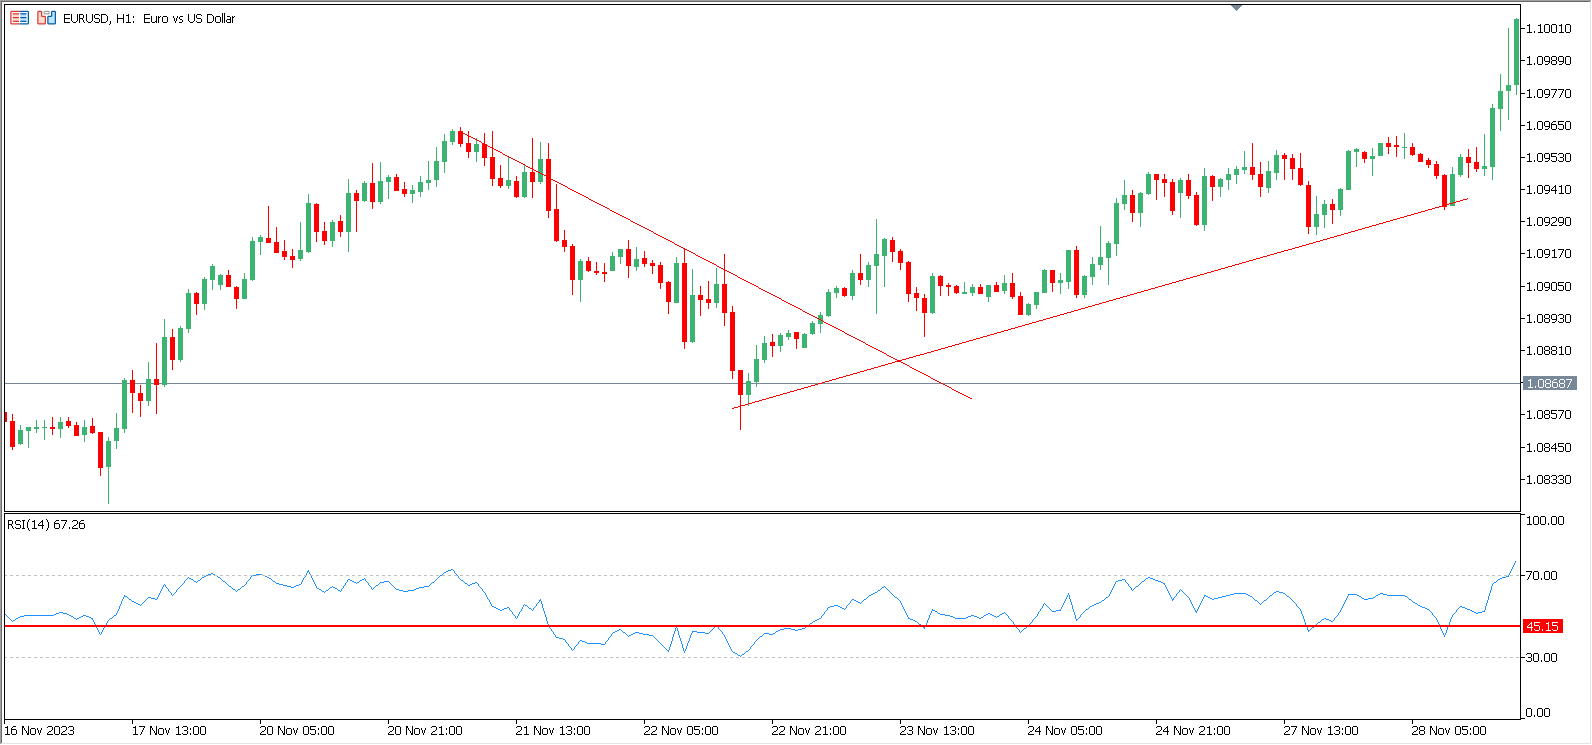
Using Trend Lines with RSI
Even though RSI is a momentum indicator, some trading strategies using RSI are based on the trend-following concept.
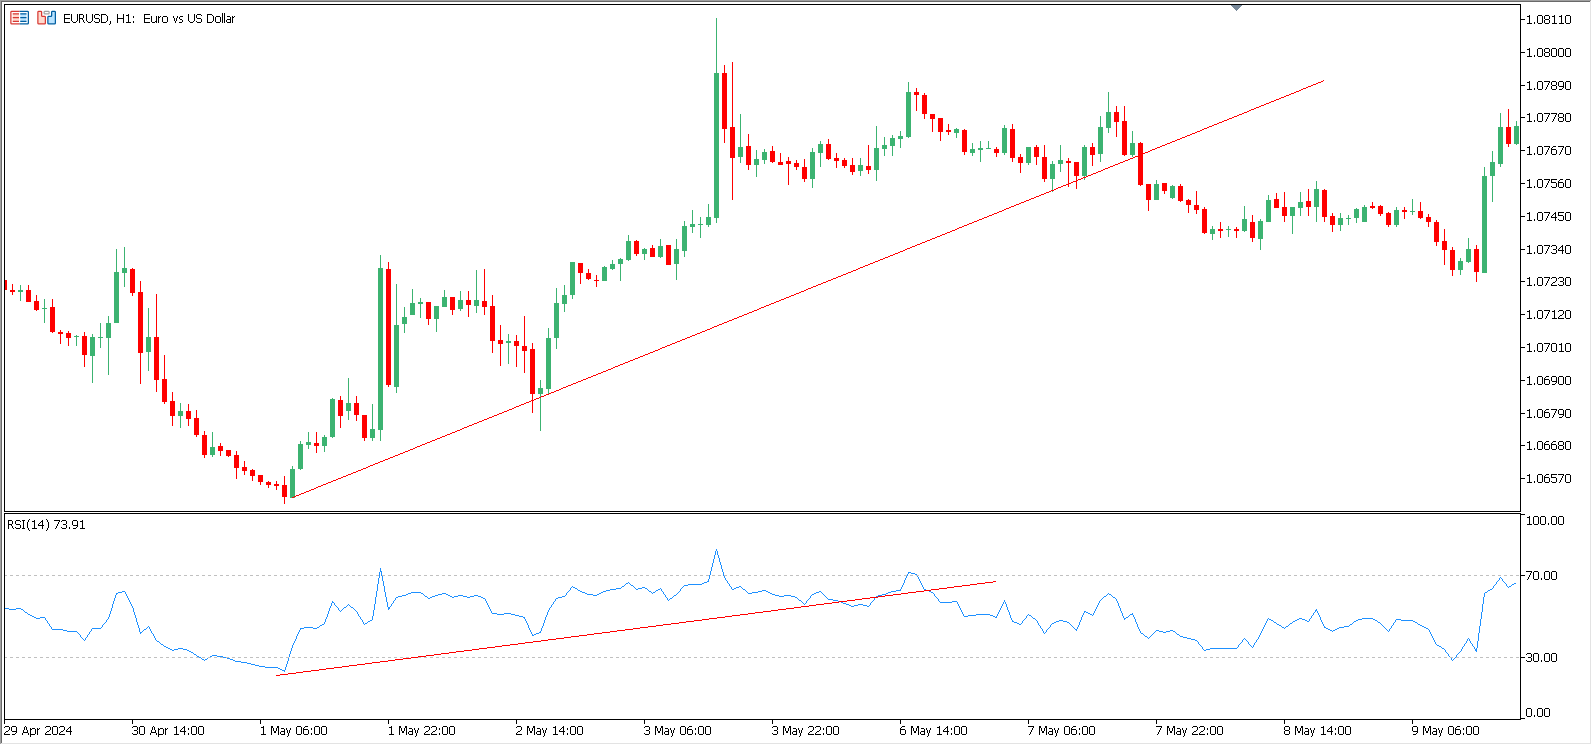
After adding the RSI indicator to the chart, a trader can draw trendlines on both the price and the indicator. Once the indicator confirms the trend, a trader can find entry points when the price hits the trendline. This approach should be used until the price and the indicator exceed the trendline. Once they break it, a reversal or correction may occur.
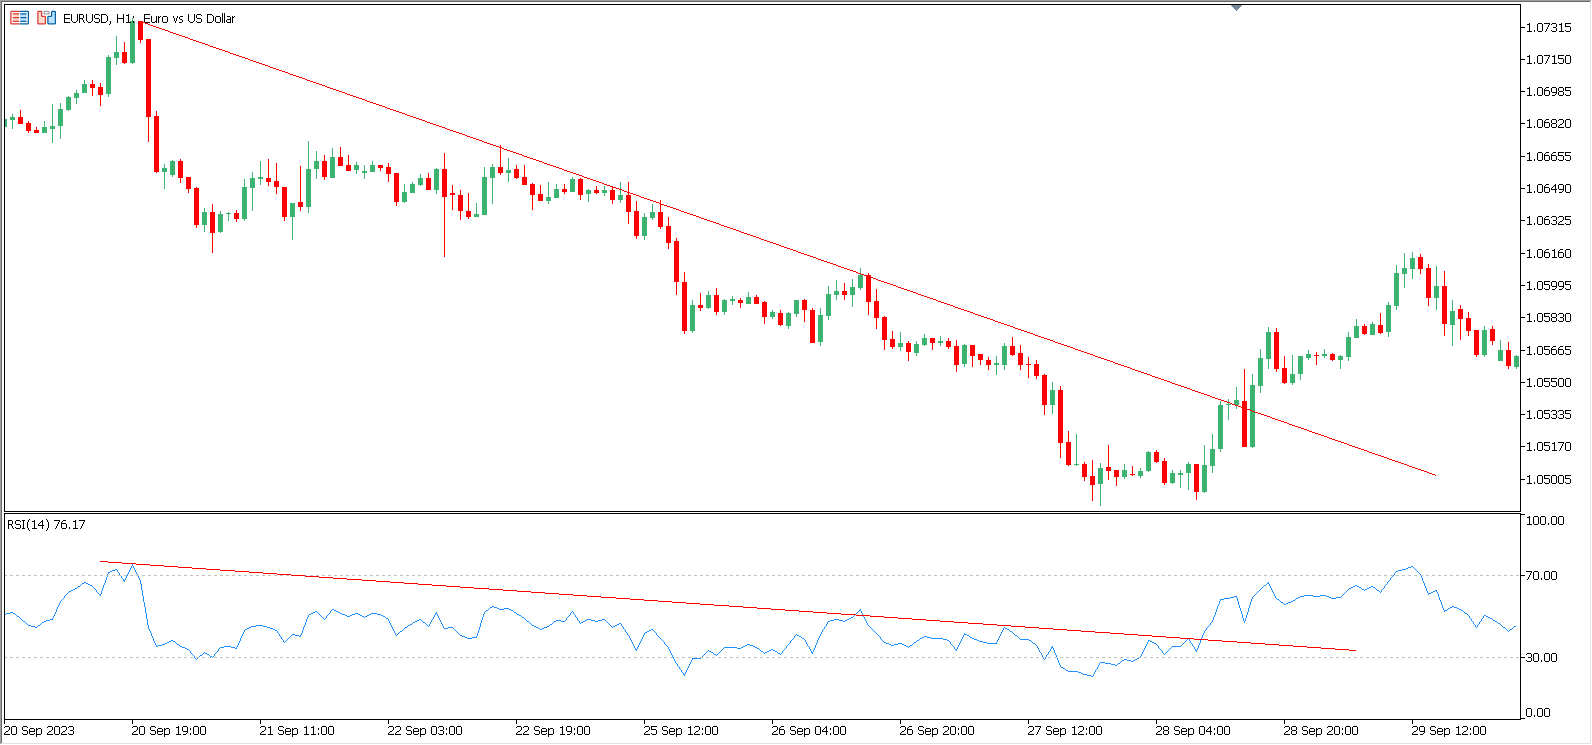
The same applies when the price moves down. Traders can use a trendline to the RSI indicator to better understand market movements. Selling can be done when the price reaches the descending trendline and reverses. Once the line is broken, all positions can be closed.
The Best RSI Strategy for Forex with Support and Resistance
Along with trendlines, traders can also use classic support and resistance levels to find entry points.
Similar to drawing trendlines on the RSI indicator, a trader can use support and resistance levels to see whether the price may stop and reverse for a correction. For example, a resistance line can prevent the price from rising. Once this resistance is broken, the line above the level indicates entry points for an uptrend.
This RSI strategy works as follows: when the price hits the trendline, and the RSI line tests the horizontal line, a trader can buy or sell depending on the direction.
Five Recommendations on How to Use RSI in Trading
The RSI indicator offers many opportunities for traders regardless of their strategies. However, one should learn more about its specifics before applying it to their trading systems. Here are five recommendations to make it even more helpful:
- Identify overbought and oversold conditions. Use the RSI to identify when an asset is overbought or oversold. An RSI above 70 typically indicates overbought conditions, suggesting a potential sell opportunity, while an RSI below 30 indicates oversold conditions, suggesting a potential buy opportunity.
- Use RSI divergence for trend reversals. Look for divergences between the RSI and the price action to identify potential trend reversals. A bullish divergence occurs when the price makes a new low, but the RSI makes a higher low, indicating a weakening downward momentum. A bearish divergence occurs when the price makes a new high, but the RSI makes a lower high, indicating weakening upward momentum.
- Combine it with other indicators. To confirm trading signals, enhance the effectiveness of the RSI by combining it with other technical indicators, such as moving averages or Bollinger Bands.
- Adjust settings for different market conditions. Modify the RSI period to suit different market conditions and trading strategies. A shorter period (e.g., 7-day RSI) will make the RSI more sensitive and generate more signals suitable for short-term trading. A more extended period (e.g., 21-day RSI) will provide a smoother, more stable signal for long-term trading.
- Use the indicator as part of a trading plan. Incorporate the RSI into a comprehensive trading plan that includes entry and exit rules, risk management, and position sizing. The RSI should be one of the many tools in your trading toolkit.
The best RSI strategy for intraday trading and various systems for mid-term and long-term trading are viral among traders nowadays. They allow market participants to buy and sell during reversals and add to their current positions when there is a directional price movement.

FAQ
What is the Best RSI for Day Trading?
The best RSI setting for day trading is often a shorter period, such as 7 or 5, as these provide more frequent signals suited for the fast pace of intraday trading. Traders may also adjust the overbought and oversold levels to 60/40 or 80/20 to better align with the asset’s volatility and specific characteristics.
Is RSI the Best Indicator?
RSI is a valuable indicator for identifying overbought and oversold conditions, but there may be better standalone tools for all traders. Combining RSI with other indicators, such as moving averages or volume analysis, can provide a more comprehensive view of market conditions and improve trading decisions.
What Are the Best RSI Settings for Swing Trading?
The best RSI settings for swing trading are typically more extended periods, such as 14 or 21, to capture more significant price trends and reduce the frequency of false signals. Swing traders often use the standard overbought and oversold levels of 70/30 or adjust them to 80/20 to better align with longer-term price movements.


