
Flags are technical patterns highly favored by traders for their ability to identify entry points within evolving trends. They offer simplicity and versatility, catering to traders of all levels, including beginners. In this article, we delve into the intricacies of flag patterns and their application in trading sessions.
Understanding a Bullish Flag
A bullish flag denotes a continuation pattern within a trending market, characterized by a downward correctional movement. Traders rely on trendlines to spot this pattern.
A bullish flag consists of two main elements: a flagpole, representing a sharp upward price movement followed by a descending correction forming the flag itself.
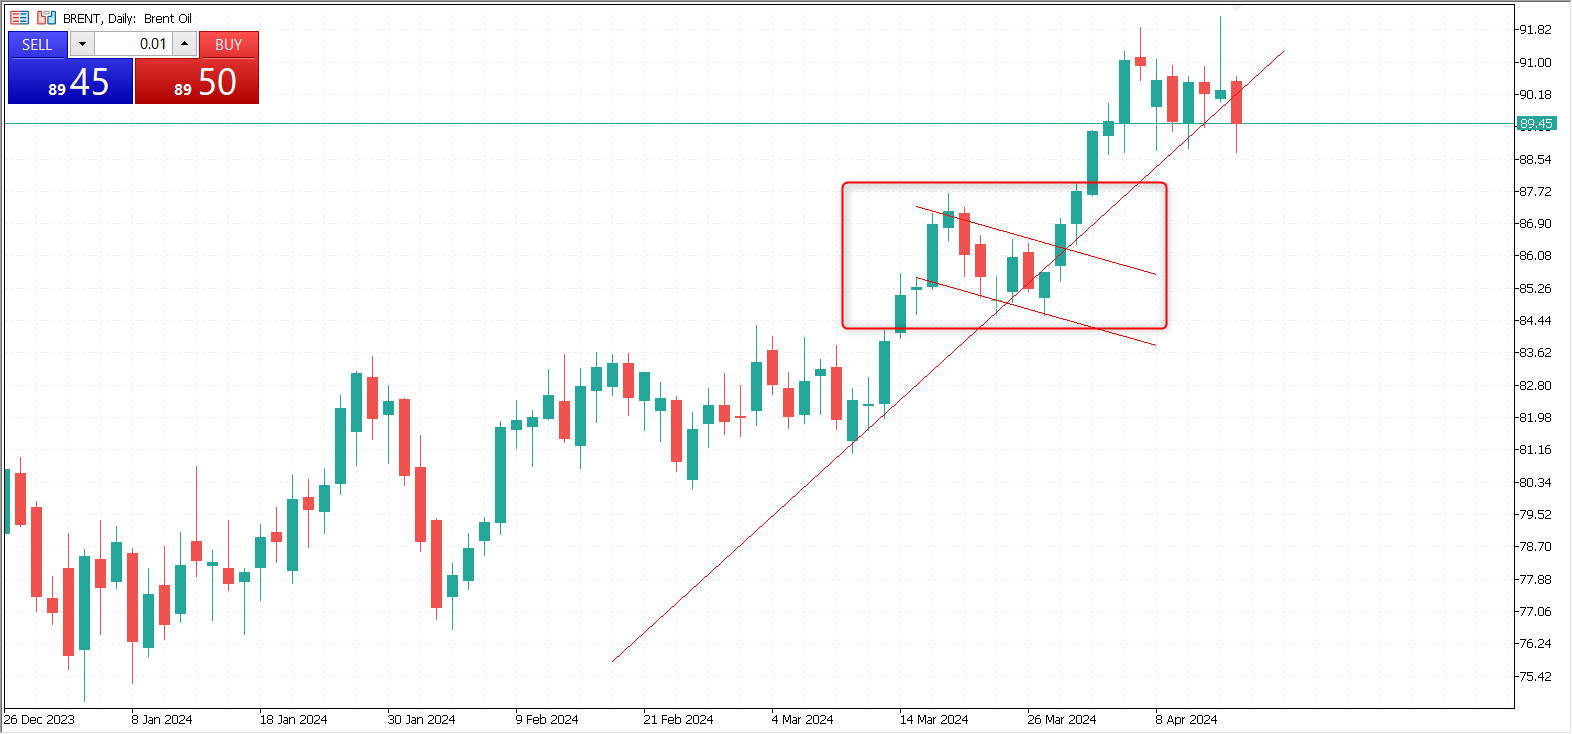
The example above illustrates a classic bullish pattern. Following a brief upside momentum, known as the flagpole, the price undergoes a slight correction to form a flag. Trading this pattern is straightforward: traders can open a buy position once the price breaks out of this descending correction.
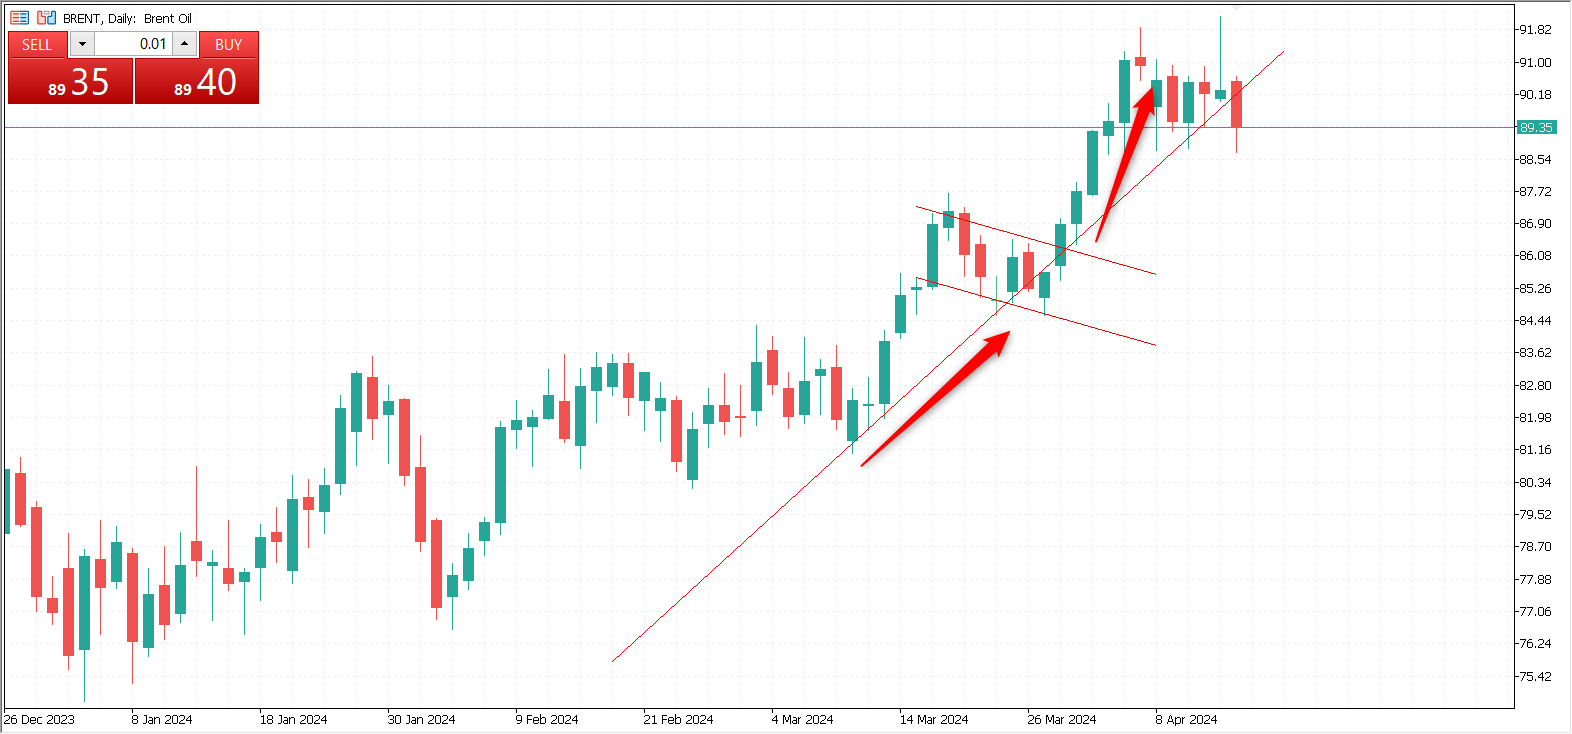
The example above demonstrates how traders can utilize a bullish flag pattern. Once the price breaks out of the flag, traders can go long. The signal occurs when the breakout candlestick closes.
How to Set Targets and Manage Risks When Trading a Bullish Flag
Flags offer traders the advantage of identifying entry points and approximating profit targets. By examining the length of the flagpole, traders can gauge potential earnings, typically correlating with the flagpole’s size post-breakout.
When setting stop losses, traders can place them below the flag’s upper trendline or based on their risk management calculations.
Understanding a Bearish Flag
Similar to its bullish counterpart, a bearish flag manifests within an ongoing trend, albeit in a downward direction.
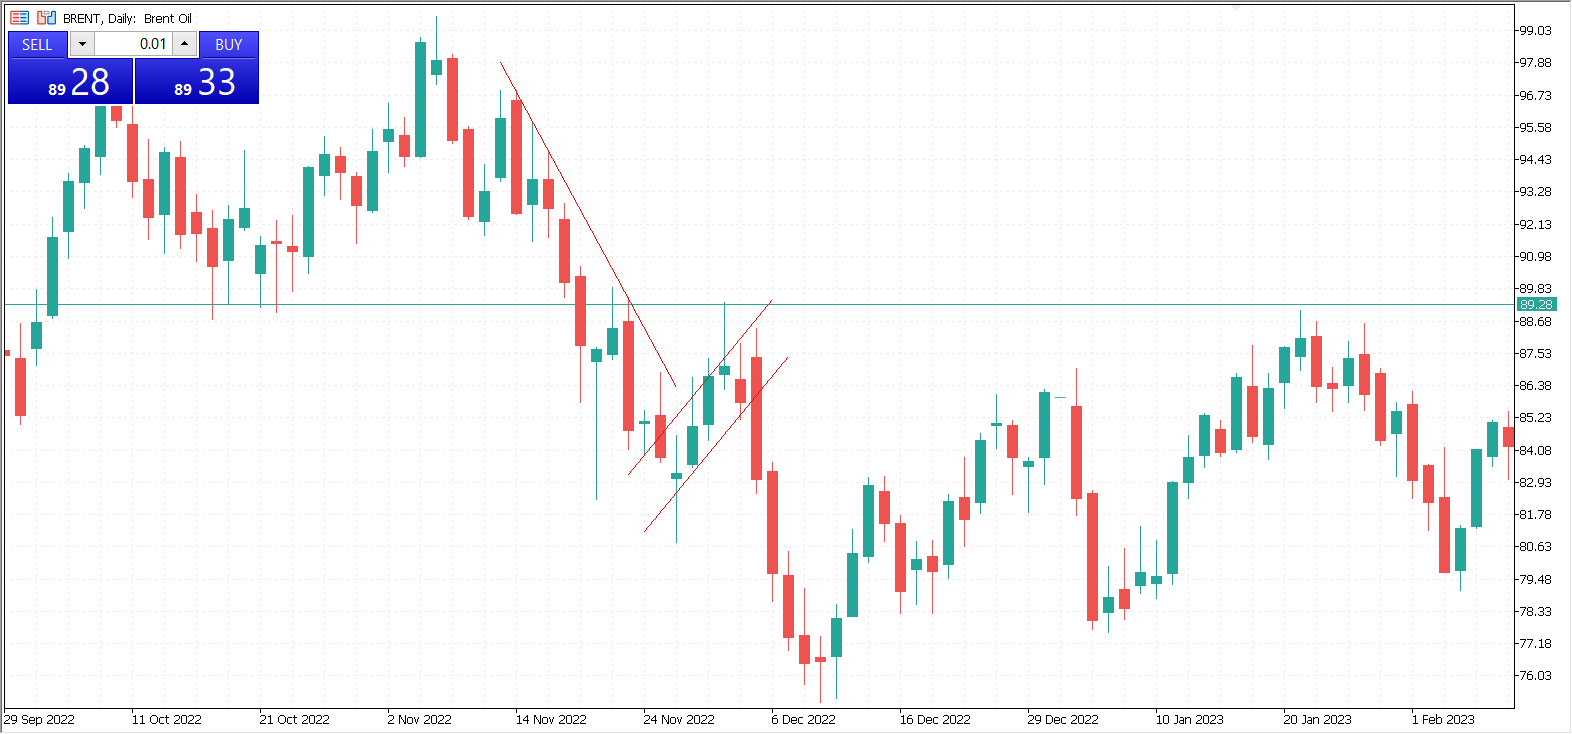
The pattern unfolds with a downward impulsive movement (flagpole) followed by an upward correction, forming the flag.
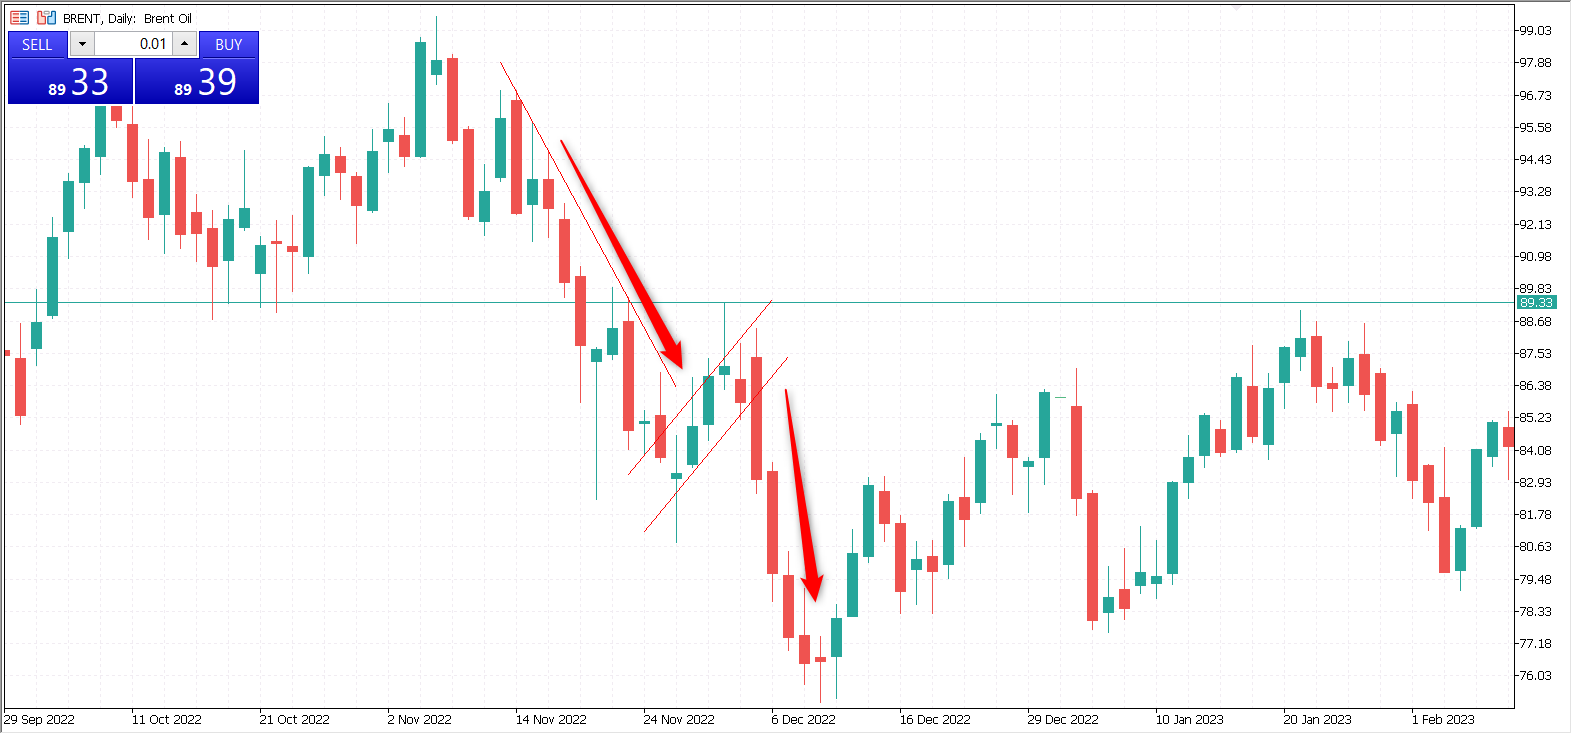
Trading a bearish flag involves selling the asset once the price breaks below the lower band of the flag, typically confirmed by a closing candlestick.
Defining Targets and Placing Stop Losses
When trading a bearish flag pattern, traders can estimate the potential distance the price may travel after breaking out of the flag formation. This distance is often equal to the length of the flagpole, which represents the impulsive downside price movement preceding the flag. Regarding risk management, traders can set stop losses above the lower band of the flag or based on their established risk management strategies.
Flag Pattern Recommendations
Trading flags can offer lucrative opportunities for traders to capitalize on trend continuation patterns. Here are some essential recommendations to help you effectively trade flag patterns and enhance your trading success:
- Identify Flag Patterns. Learn to recognize flag patterns on price charts, characterized by a period of consolidation after a substantial price movement in one direction. Flags typically appear as a rectangular-shaped consolidation phase, with parallel trend lines indicating support and resistance levels.
- Confirm with Volume. Confirm flag patterns with volume analysis. Look for a decrease in trading volume during the consolidation phase, signaling a temporary pause or hesitation in the market before continuing the previous trend. A breakout with increasing volume can confirm the flag pattern’s validity.
- Set Clear Entry and Exit Points. Define straightforward entry and exit points based on the flag pattern’s breakout. Enter a trade when the price breaks out of the flag in the direction of the preceding trend, ideally accompanied by a surge in volume. Set stop-loss orders below the flag’s support level to manage risk and preserve capital.
- Use Technical Indicators. Utilize technical indicators such as moving averages, MACD, or RSI to confirm the trend’s strength and identify potential entry signals. For example, a bullish crossover of moving averages or a bullish divergence on the RSI can provide additional confirmation of a bullish flag pattern.
- Practice Patience and Discipline. Exercise patience and discipline when trading flag patterns. Wait for unambiguous confirmation of the breakout before entering a trade, and avoid chasing the price or entering prematurely. Stick to your trading plan and risk management rules to minimize losses and maximize profits over the long term.
- Monitor Market Sentiment. Keep an eye on market sentiment and external factors that may impact the price movement of the underlying asset. News events, economic indicators, and geopolitical developments can influence market sentiment and affect the outcome of flag pattern trades.
- Review and Learn. After each trade, review your performance and analyze the outcome. Identify strengths and weaknesses in your trading approach, and learn from both successful and unsuccessful trades. Continuously refine your trading strategy and adapt to changing market conditions to improve your overall trading performance.

Trading flag patterns can significantly enhance a trader’s success by providing clear opportunities to capitalize on trend continuations. However, it’s crucial to approach flag pattern trading with patience, discipline, and a deep understanding of market dynamics. With proper analysis, strategic planning, and adherence to risk management principles, traders can navigate financial markets confidently and consistently. By trading flag patterns with AMarkets, traders will have access to various technical analysis and drawing tools to help them find entry points more precisely.


