
The confluence of signals occurs when multiple indicators, patterns, or market factors all point toward the same trade decision. This alignment improves the probability of success and increases trader confidence, turning individual signals into stronger, more reliable setups.
By reading this article, traders will learn how to identify and use confluence to make more informed trading decisions.
Why Confluence Matters
Trading based on a single indicator can be risky: false signals are common, and one wrong cue can lead to losses. This is where confluence makes a difference. When multiple indicators, patterns, or factors align, the trade setup becomes stronger and more reliable.
Confluence doesn’t just improve trade accuracy, it also supports better risk management. Trades confirmed by several signals tend to carry lower risk than those based on one signal alone. On top of that, seeing multiple factors pointing in the same direction gives traders the confidence to execute trades decisively, reducing hesitation and emotional stress.

Types of Signals for Confluence
Confluence works best when traders combine different types of signals. These can come from technical indicators, price action, volume, momentum, or even fundamental news.
Technical Indicators
Popular technical tools include moving averages (especially crossovers), RSI, MACD, and stochastic signals, as well as trendlines and key support/resistance levels. When several of these indicators align, they create a stronger signal for potential trades.
Price Action Patterns
Price action offers visual cues about market behavior. Common signals include candlestick patterns like pin bars, engulfing candles, or dojis, and chart patterns such as head & shoulders, double tops, or double bottoms. These patterns help confirm the signals given by technical indicators.

Volume & Momentum
Volume and momentum add another layer of confirmation. Volume spikes or divergences often indicate strong moves, while momentum indicators can confirm the direction of a trend, reinforcing the trade setup.
Fundamental or News Signals
Fundamental events can also serve as confluence factors. Earnings reports, macroeconomic releases, or central bank announcements can trigger or support trades suggested by technical and price action signals.
How to Identify Confluence
Identifying confluence is about systematically layering signals to find stronger trade setups.
- Step 1: Define your core indicators. Start with a combination that suits your strategy, such as a trend-following tool plus an oscillator.
- Step 2: Look for alignment across timeframes. Check higher and lower timeframes (e.g., daily and 4-hour charts) to see if signals point in the same direction.
- Step 3: Confirm with price action and support/resistance. Candlestick patterns, trendlines, and key levels can validate what your indicators are suggesting.
- Step 4: Factor in market context. Consider overall trend strength, volatility, and relevant news or economic events to ensure the setup fits the bigger picture.
By following these steps, traders can filter out weaker signals and focus on setups with higher probability and confidence.
Examples of Confluence in Trading
Confluence becomes clear when multiple signals align to support the same trade decision. Here are a few examples.
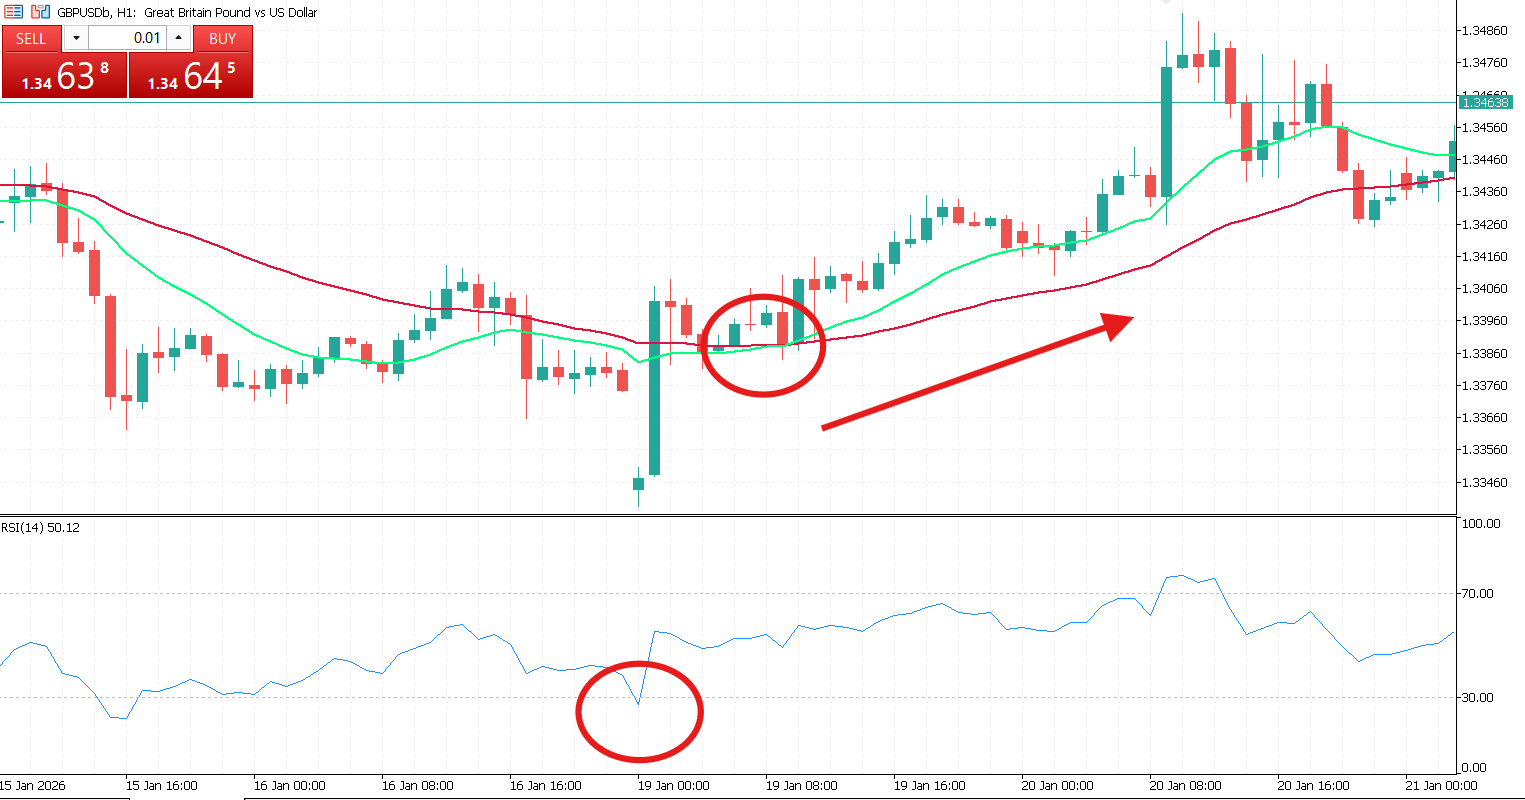
Example 1: A moving average crossover occurs at the same time the RSI shows oversold conditions near a key support level, a strong buy signal emerges.
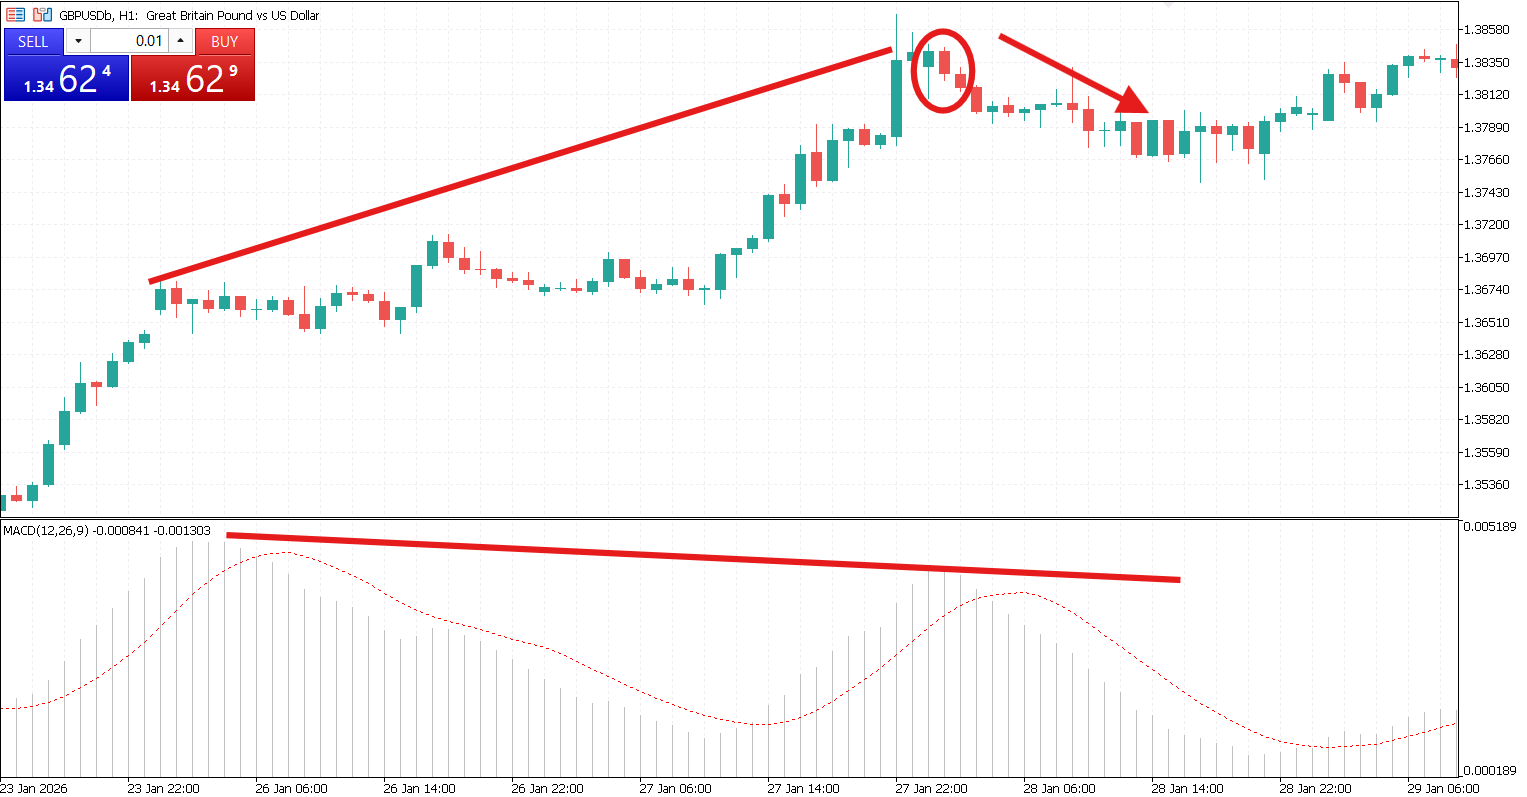
Example 2: A bearish engulfing candlestick forms at resistance while the MACD shows divergence, signaling a potential sell opportunity.
Example 3: A trendline break is confirmed by a volume spike and supported by fundamental news, creating a higher-confidence trade setup.
These examples illustrate how layering indicators, price action, and context can turn individual signals into high-probability trades.

Common Mistakes
Even experienced traders can fall into pitfalls when trying to use confluence. Being aware of these mistakes can save both time and capital:
- Relying on a single signal. Some traders mistake one indicator for confluence. True confluence requires multiple independent factors pointing in the same direction, which provides a stronger and more reliable trade signal.
- Ignoring timeframes or context. A signal on one chart may be misleading if it conflicts with higher- or lower-timeframe trends. Understanding the broader market context ensures signals are meaningful and aligned with overall trends.
- Overcomplicating setups. Adding too many indicators can create conflicting signals, leading to analysis paralysis. Confluence works best when a few complementary tools are combined thoughtfully.
- Neglecting news and fundamentals. Strong technical setups can fail if major economic events, earnings reports, or central bank announcements are ignored. Incorporating fundamental context helps traders avoid surprises and make more informed decisions.

Confluence is a powerful approach that increases the probability of successful trades, reduces risk, and boosts trader confidence. By focusing on simplicity, clarity, and consistency, traders can identify truly aligned signals without overcomplicating their strategies.
To maximize the benefits of confluence, it’s essential to backtest setups and keep a trading journal, tracking which combinations of indicators, patterns, and market factors work best. Over time, this disciplined approach helps traders develop a reliable, high-probability trading strategy grounded in both analysis and experience.
 in Trading")


