
Named after its creator, Marc Chaikin, the Chaikin Oscillator is widely used by traders to assess whether money is flowing into or out of a security. By combining price action with volume data, it helps traders detect bullish or bearish pressure before it becomes obvious on the price chart alone. This article explores the Chaikin Oscillator in depth, its calculation, interpretation, trading strategies, advantages, limitations, and practical applications in modern trading.
What Is the Chaikin Oscillator?
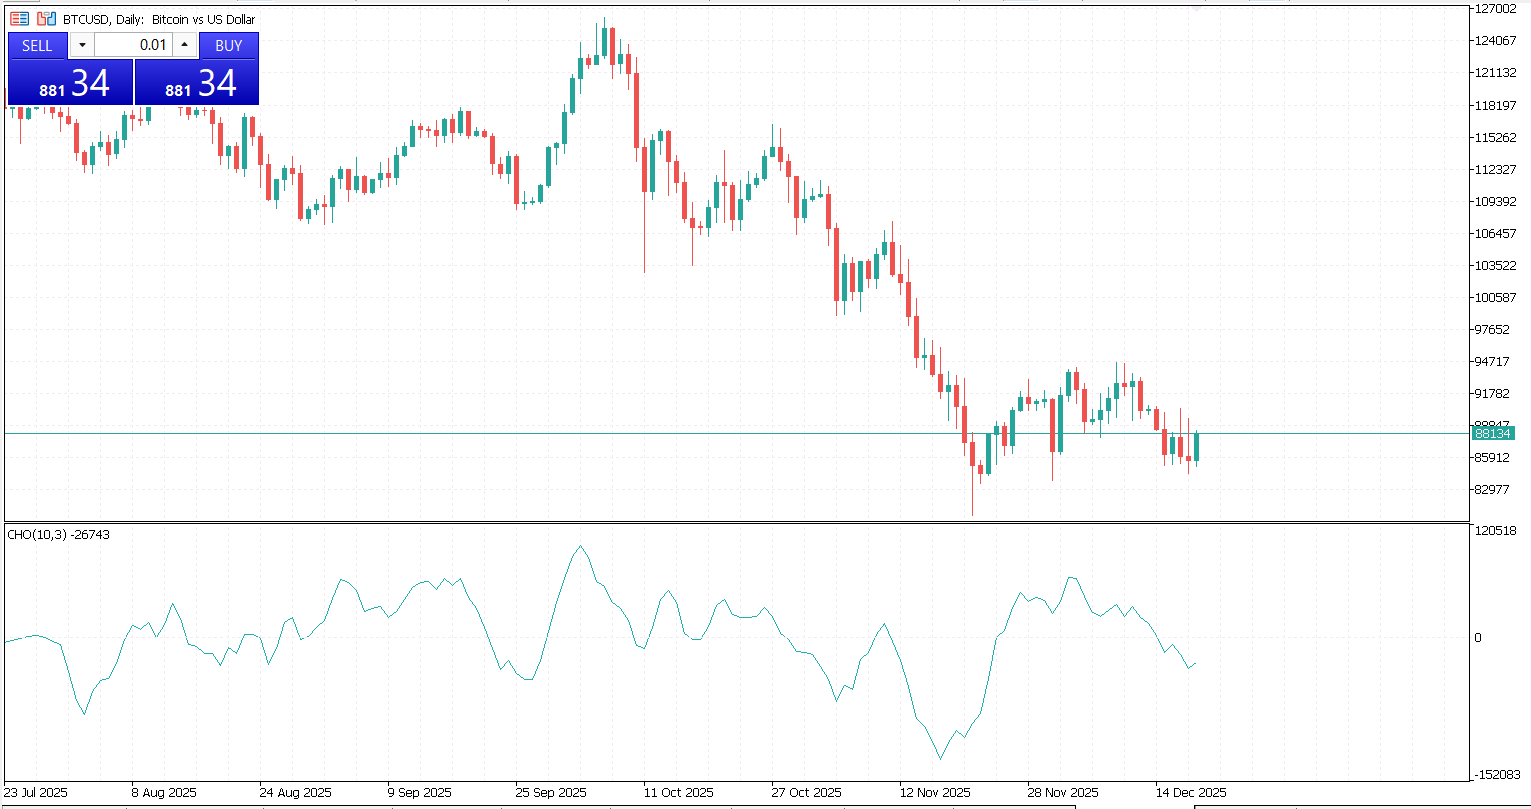
The Chaikin Oscillator is a momentum indicator that measures the difference between two exponential moving averages (EMAs) of the Accumulation/Distribution Line (ADL). Its primary purpose is to identify changes in momentum driven by buying and selling pressure.
Unlike trend-following indicators, the Chaikin Oscillator focuses on momentum shifts, making it particularly useful for spotting early signals of trend changes, confirmations, and divergences. It oscillates above and below a zero line, indicating whether accumulation (buying pressure) or distribution (selling pressure) dominates the market.
The Accumulation/Distribution Line (ADL)
To understand the Chaikin Oscillator, one must first understand the Accumulation/Distribution Line, as it forms the foundation of the indicator.
The ADL measures how much volume is flowing into or out of a security based on where the closing price falls within the day’s trading range. If the price closes near the high, it suggests accumulation; if it closes near the low, it suggests distribution.
The ADL is cumulative, meaning it continuously adds or subtracts volume, creating a running total that reflects long-term buying and selling pressure.
Interpreting the Chaikin Oscillator
Zero Line Crossovers, Values, and Divergences
When the Chaikin Oscillator is above the zero line, it indicates bullish momentum and accumulation, while readings below zero point to bearish momentum and distribution. A move above the zero line is often viewed as a potential buy signal, whereas a move below zero may signal a potential sell. Zero-line crossovers are commonly used to confirm trend direction, especially when they align with price action or other technical indicators.
The size of the oscillator’s values reflects the strength of momentum. Strong positive readings suggest heavy buying pressure, while deep negative values indicate strong selling pressure. At the same time, extreme readings should not be interpreted as overbought or oversold conditions, since the Chaikin Oscillator is not bounded like RSI or stochastic indicators.
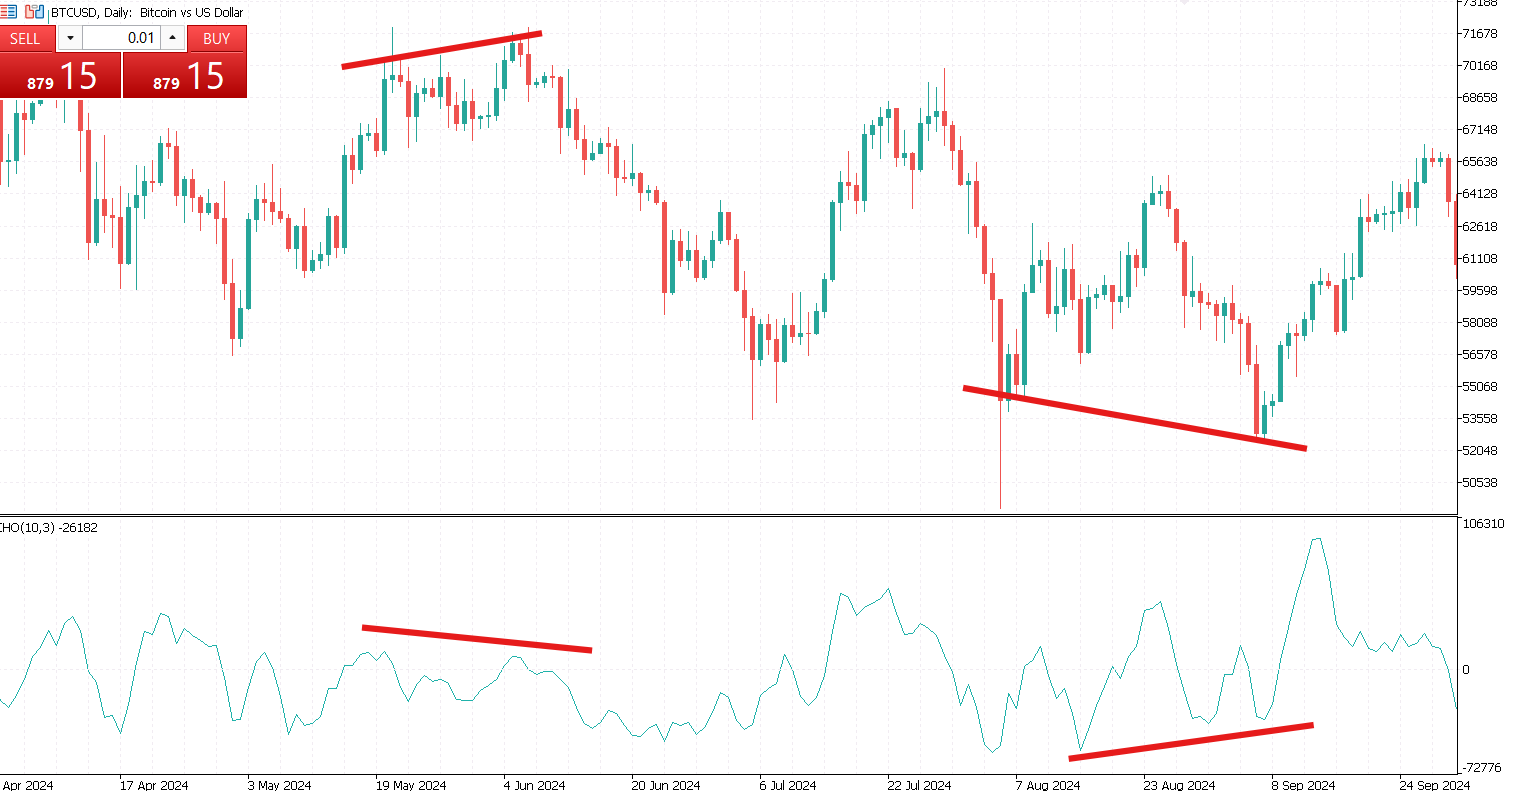
One of the most powerful applications of the Chaikin Oscillator is identifying divergences between price and momentum. A bullish divergence occurs when price makes lower lows while the oscillator forms higher lows, signaling that selling pressure is weakening. A bearish divergence appears when price reaches higher highs while the oscillator makes lower highs, suggesting fading buying pressure. Such divergences often precede reversals, particularly when confirmed by other technical tools.
Trading Strategies Using the Chaikin Oscillator
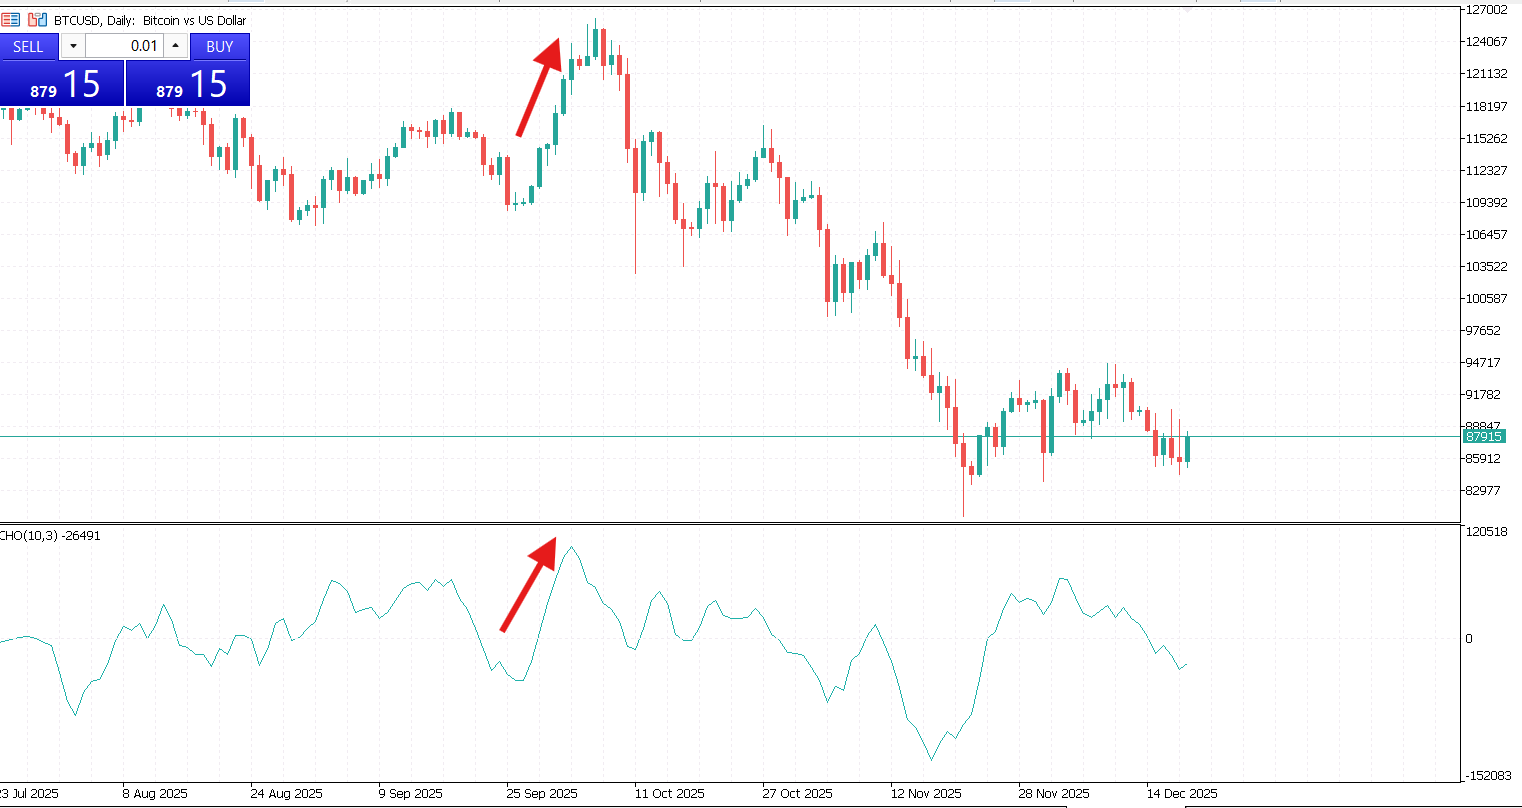
Traders frequently use the Chaikin Oscillator to confirm existing trends. In an uptrend, readings that remain above zero support a bullish bias, while in a downtrend, staying below zero reinforces a bearish outlook. This helps traders stay aligned with underlying momentum and avoid false breakouts.
The indicator is also useful for confirming breakouts. When price breaks above resistance, rising oscillator values suggest strong participation and increase confidence in a bullish move. Conversely, falling oscillator values during a break below support confirm selling pressure and strengthen bearish signals. This confirmation reduces the risk of acting on false breakouts.
Because the Chaikin Oscillator reacts relatively quickly to changes in volume, it is well suited for short-term trading approaches such as swing trading, short-term trend trading, and momentum-based strategies. Traders often combine it with moving averages or price patterns to improve the timing of entries and exits.

Advantages of the Chaikin Oscillator
- Volume-based insight. Incorporates volume, offering information that price-only indicators miss.
- Early signals. Often detects momentum shifts before price reversals occur.
- Versatility. Works across multiple timeframes and asset classes.
- Simple interpretation. Zero-line crossovers and divergences are easy to understand.
- Strong confirmation tool. Enhances reliability when used with other indicators.
Limitations of the Chaikin Oscillator
Despite its strengths, the Chaikin Oscillator has limitations:
- Not a standalone indicator. Best used in combination with other tools.
- Whipsaws in sideways markets. Can produce frequent false signals during consolidation.
- Lagging nature. Relies on EMAs, which introduce some delay.
- Volume dependency. Less effective in markets with unreliable or low volume data.
Understanding these limitations helps traders apply the indicator more effectively and avoid overreliance.
The Chaikin Oscillator is a valuable technical indicator that bridges the gap between price movement and volume analysis. By measuring the momentum of accumulation and distribution, it provides traders with deeper insight into the underlying forces driving market trends. Its ability to identify momentum shifts, confirm trends, and reveal divergences makes it a powerful addition to any trader’s toolkit.
However, like all technical indicators, the Chaikin Oscillator is most effective when used in combination with other analysis methods. When applied thoughtfully and with proper confirmation, it can enhance timing, reduce false signals, and improve overall trading performance. Whether used by beginners or experienced traders, the Chaikin Oscillator remains a relevant and practical tool in modern technical analysis.


