
Understanding the market direction is among the top priorities for every trader. Markets rarely move randomly. Prices tend to follow trends that reflect investor sentiment, economic conditions, and supply and demand.
Learning how to identify these trends can help traders make more informed decisions, manage risk, and improve their overall trading strategy. In this guide, we’ll explore how trading trends work and the most common methods traders use to identify them.
What Is a Trend in Trading?
A market trend is the general direction in which the price of an asset moves over a period of time. Trends show the prevailing market sentiment, whether buyers (bulls) or sellers (bears) are in control. It helps traders make informed decisions about when to enter or exit trades.
There are three main types of trends in trading:
- Uptrend. Prices make higher highs and higher lows, indicating bullish market sentiment.
- Downtrend. Prices make lower highs and lower lows, reflecting bearish market sentiment.
- Sideways trend (ranging markets). Prices move within a horizontal range with no clear direction, signaling indecision or consolidation in the market.

Why Trend Identification Matters for Traders
Identifying trends is one of the most important skills a trader can develop because it directly affects which strategy you will choose and how profitable your trading will be. When a trader understands the prevailing market direction, they can make decisions that align with the forces driving price movements, rather than working against them.
First, trend identification helps determine entry and exit points. By recognizing whether the market is trending upward, downward, or sideways, traders can enter positions in the direction of the trend, which increases the probability of a successful trade. Similarly, understanding the trend allows traders to anticipate potential reversal points and exit trades at the right time, protecting profits and avoiding unnecessary losses.
Second, trend analysis allows you to manage risks in a more effective manner. Trading against the trend is riskier, while trading with the main price direction allows for more calculated risk-taking. Traders can use trendlines, moving averages, or other indicators to set stop-loss levels strategically, ensuring that losses are minimized if the market moves unexpectedly. This makes trend awareness a critical tool for controlling exposure and maintaining a sustainable trading approach.
Finally, trend identification helps make data-driven decisions during periods of higher volatility. Markets can be unpredictable, with sudden price swings and short-term noise that can confuse even experienced traders. By focusing on the overall trend, traders can filter out minor fluctuations and make more disciplined decisions. This ability to stay aligned with market direction reduces emotional trading and increases the likelihood of consistent results over time.
Using Trendlines to Identify Market Direction
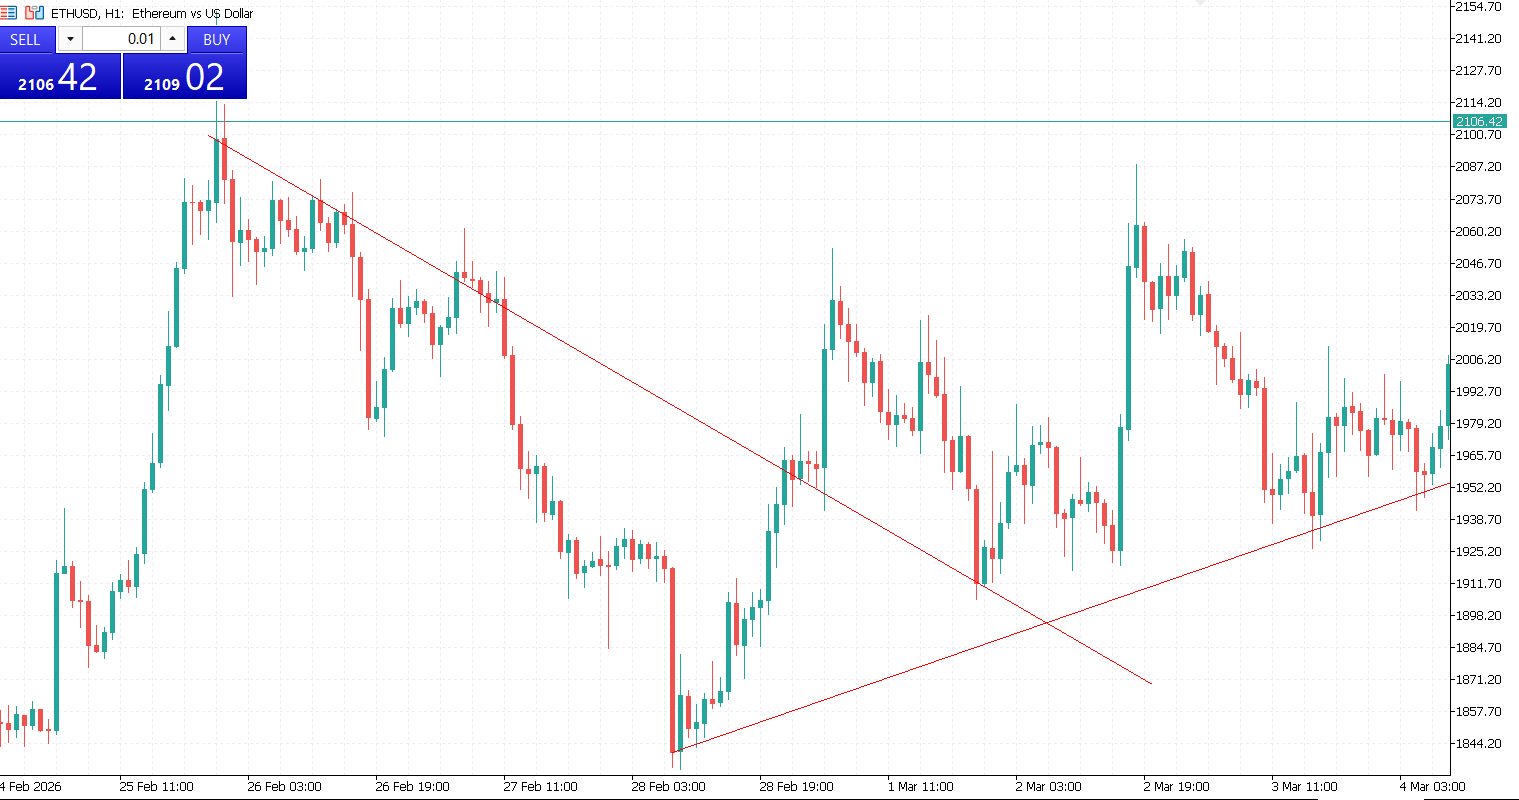
Trendlines are one of the simplest yet most powerful tools traders use to identify market direction. A trendline is a straight line drawn on a chart that connects a series of price points, highlighting the overall direction of the market.
Drawing trendlines starts with identifying key price points. In an uptrend, traders connect successive higher lows to create a support trendline, showing where buying interest consistently enters the market.
In a downtrend, connecting lower highs forms a resistance trendline, indicating areas where selling pressure dominates. Sideways or ranging markets often have horizontal lines that mark clear support and resistance levels, helping traders recognize consolidation zones.
Trendlines also help confirm the strength of a trend. The more times the price touches the trendline without breaking it, the stronger and more reliable the trend is considered to be. Conversely, a break of the trendline can signal a potential trend reversal or a slowdown in momentum, alerting traders to adjust their strategy. By combining trendlines with other tools like moving averages or volume analysis, traders can gain a clearer picture of market direction and trade with greater confidence.
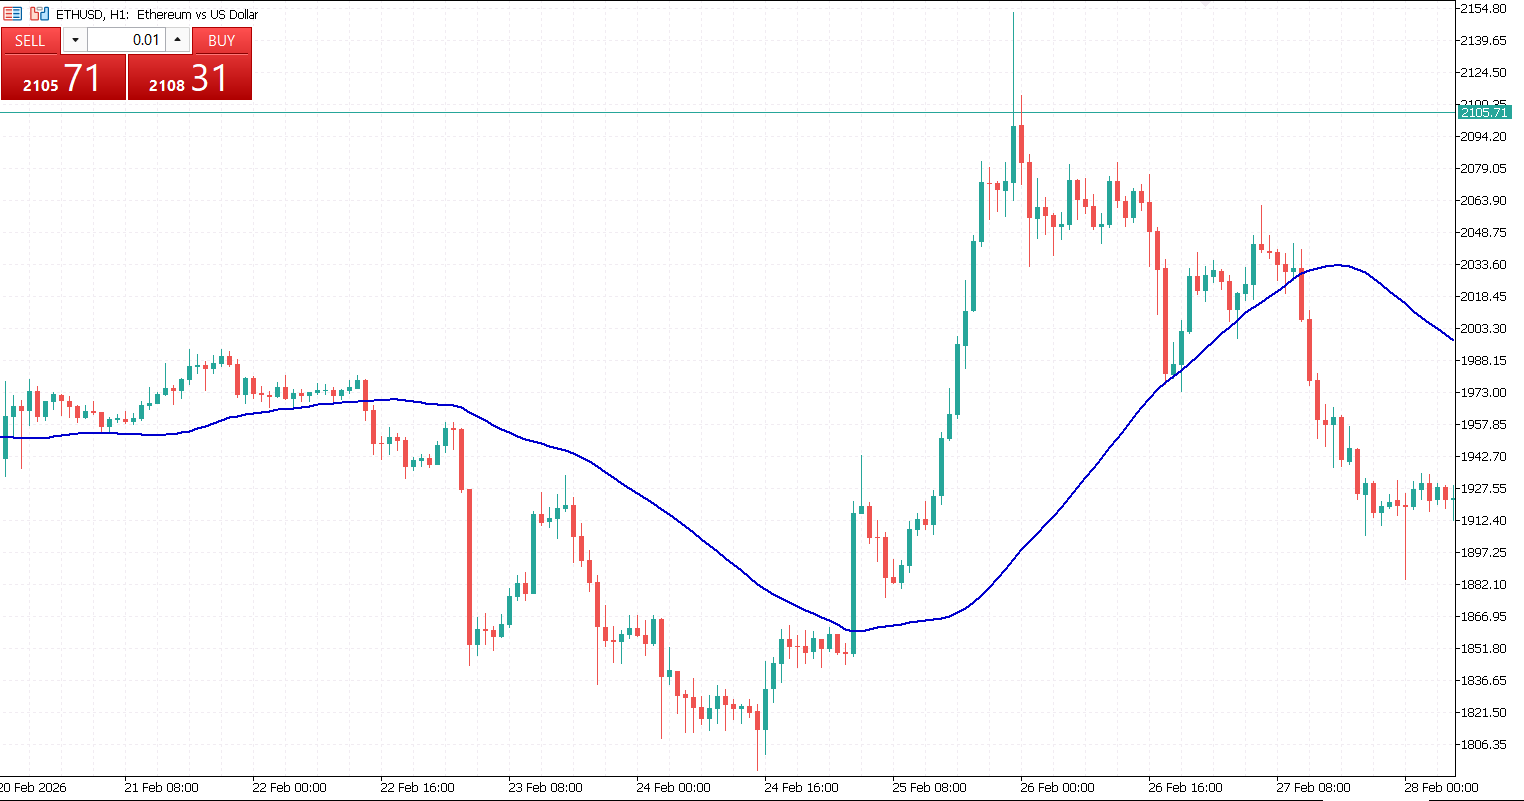
Moving Averages as Trend Indicators
Moving averages are one of the most widely used tools in trading for identifying trends and smoothing out price fluctuations. They calculate the average price of an asset over a specific period, helping traders see the overall market direction without being distracted by short-term volatility.
Traders often use two types of moving averages: simple moving averages (SMA) and exponential moving averages (EMA). An SMA gives equal weight to all price points over the chosen period, providing a straightforward view of the average price.
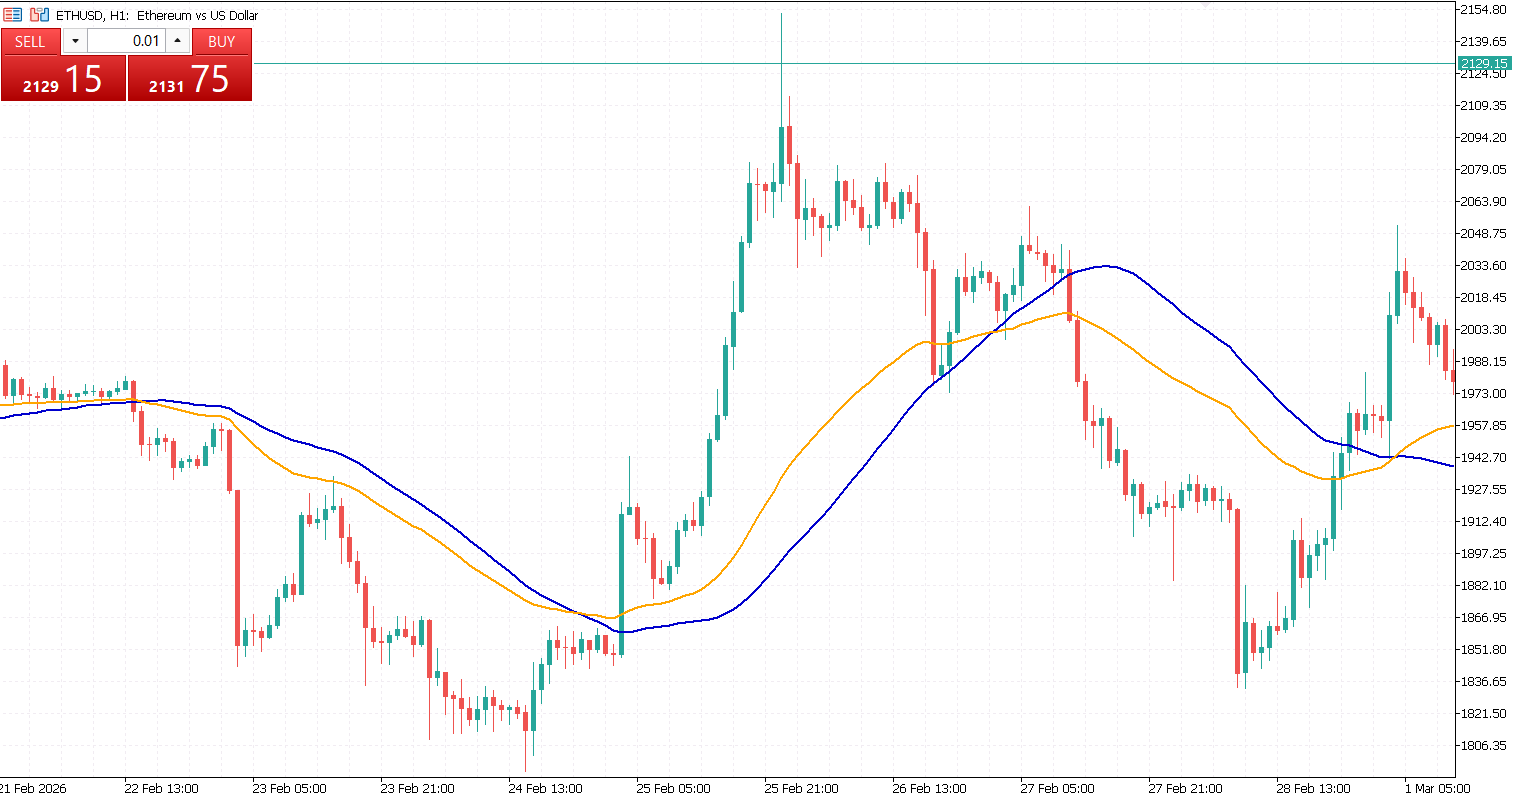
An EMA, on the other hand, gives more weight to recent prices, making it more responsive to recent market movements. Traders often choose between SMA and EMA depending on whether they prefer a smoother long-term view or a more sensitive short-term indicator.
Popular moving average strategies include using single or multiple moving averages to confirm trends. A common approach is the moving average crossover, where a short-term moving average crosses above or below a long-term moving average. When the short-term average crosses above the long-term average, it signals a potential uptrend; when it crosses below, it may indicate a downtrend.
Moving averages can also be used as support and resistance levels. Prices often bounce off these lines during trending markets, providing market participants with information about where to enter or exit. By combining moving averages with other indicators, traders can confirm the strength and direction of trends, reduce false signals, and make more informed trading decisions.

Combining Multiple Tools for Better Trend Analysis
Relying on a single indicator can be risky, as no tool perfectly predicts market movements. Combining multiple approaches provides a clearer view of directional price movements and helps reduce false signals. Traders often integrate technical indicators, price action, patterns, and multi-timeframe analysis to make smarter, more confident decisions.
Here are some of the most popular combinations that you can use:
- Technical indicators + price action. Use indicators like moving averages, MACD, or RSI alongside candlestick patterns, trendlines, and support/resistance to confirm trends.
- Multi-timeframe analysis. Examine daily, 4-hour, and 1-hour charts to understand both long-term direction and short-term fluctuations.
- Building a consistent trading strategy. Define rules for trend confirmation, risk management, and trade execution to reduce emotional decisions and improve long-term performance.
Identifying trends is a fundamental part of successful trading. By understanding how markets move and using tools such as trendlines, moving averages, and technical indicators, traders can better recognize market direction and make more informed decisions.
While no method guarantees perfect predictions, combining different analysis techniques can help traders improve accuracy and build a more disciplined trading approach.


